Dear Lucy automatically translates your CRM data into fact-based sales forecasts. There are two types of sales forecasts in Dear Lucy's default sales dashboards:
- Opportunity-based sales forecast
- Activity-based sales forecast
The opportunity based forecast is quite straight forward and used your weighted pipeline by close date, combined with your actual won deals, to determine your sales result by the end of the year. The activity-based forecast is a bit more complex as it uses historic averages to predict your sales result, based on your scheduled activities.
Opportunity-based sales forecast
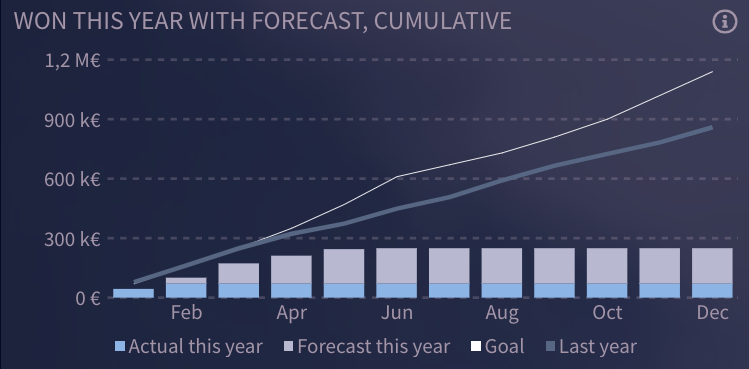
The calculation behind the Won this year with forecast, cumulative metric is as follows:
Won deal values, by close date + (value of open opportunities x respective opportunity probability)
In other words, the forecast is determined by your weighted pipeline value, but only for deals with expected close dates in the future within the current calendar year.
Activity-based sales forecast
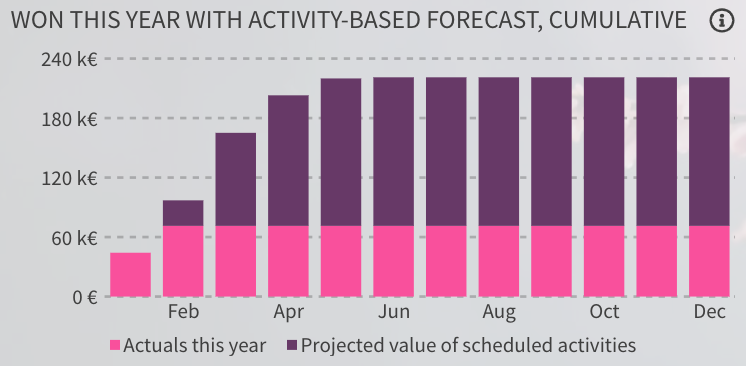
The activity-based sales forecast is intended to give you a better view on whether your current activity efforts will be enough for you to reach your sales target by the end of the year. It's accuracy is better in the short-term, as most often activities are not scheduled more than 1-3 months in advance.
The forecast is based on a number of calculations derived from your performance over the last 12 months and the formula used is shown below:
Won deal values, by close date + (avg revenue per activity x number of scheduled activities in the future this year)
The activity-based forecast is available on the dashboard called Sales: Activities Forecasting, which also contains all the metrics used to calculate the activity-based forecast. Since not all activities listed in your CRM necessarily has a correlation with Sales (e.g. notes or to-do tasks), we recommend that this dashboard has an Activity by Type filter applied to it. For example, you may want to use the forecast only based on activities such as meetings, calls and emails that are directly linked to opportunities and deals.
Additional predictive metrics on this dashboard are:
Current projected value of scheduled activities:
Using the average revenue per activity over the last 12 months (value of all won deals / number of activities), we project the total value of your scheduled activities in the future.
Current projected number of of future won deals:
Using the average number of activities per won deal over the last 12 months (number of activities / number of won deals), we project the number of won deals you will have for the rest of the calendar year, based on your scheduled activities.
Metrics used for calculating the activity-based forecasts:
Please note that 12-month rolling values are calculated as starting from the 1st day of the same month as right now last year, up until today.
Average deal size last 12 months (rolling): Value of all won deals / Number of won deals
Average revenue per activity last 12 months (rolling): Value of all won delas / Number of activities
Average number of activities per won deal last 12 months (rolling): Number of activities / Number of won deals
Number of won deals last 12 months (rolling): Sums up the number of won deals in the last 12 months.
Total activities last 12 months (rolling): Sums up the number of activities over the last 12 months.
Activity win rate %: (Number of won deals / number of activities) x 100
Last year's activity-based forecast versus last year's actuals: This metric is the same as the forecast metric, but applied to last year's sales result. In other words, this metric can be used to verify the accuracy of the forecast as we use last years forecasted values as they were then, versus last year's actual sales.
We recommend that you also read through the following articles if you are using the activities-based forecast:
Metrics in Sales: Activity Forecast (Pipedrive)
Metrics in Sales: Activity Forecast (HubSpot)
Applying dropdown dimension filters
Comments
0 comments
Article is closed for comments.