Adding goals and dimension filters to your dashboards makes them even more valuable as you'll be able to monitor and follow-up on your performance in real-time, by e.g. business unit, person or activity type.
Setting goals in Dear Lucy
You can set goals directly in the dashboard view in Dear Lucy. When hovering your mouse over a metric on the dashboard, a small target icon will appear in the bottom-left corner of the widget where a goal can be added (visible only to Admin users).
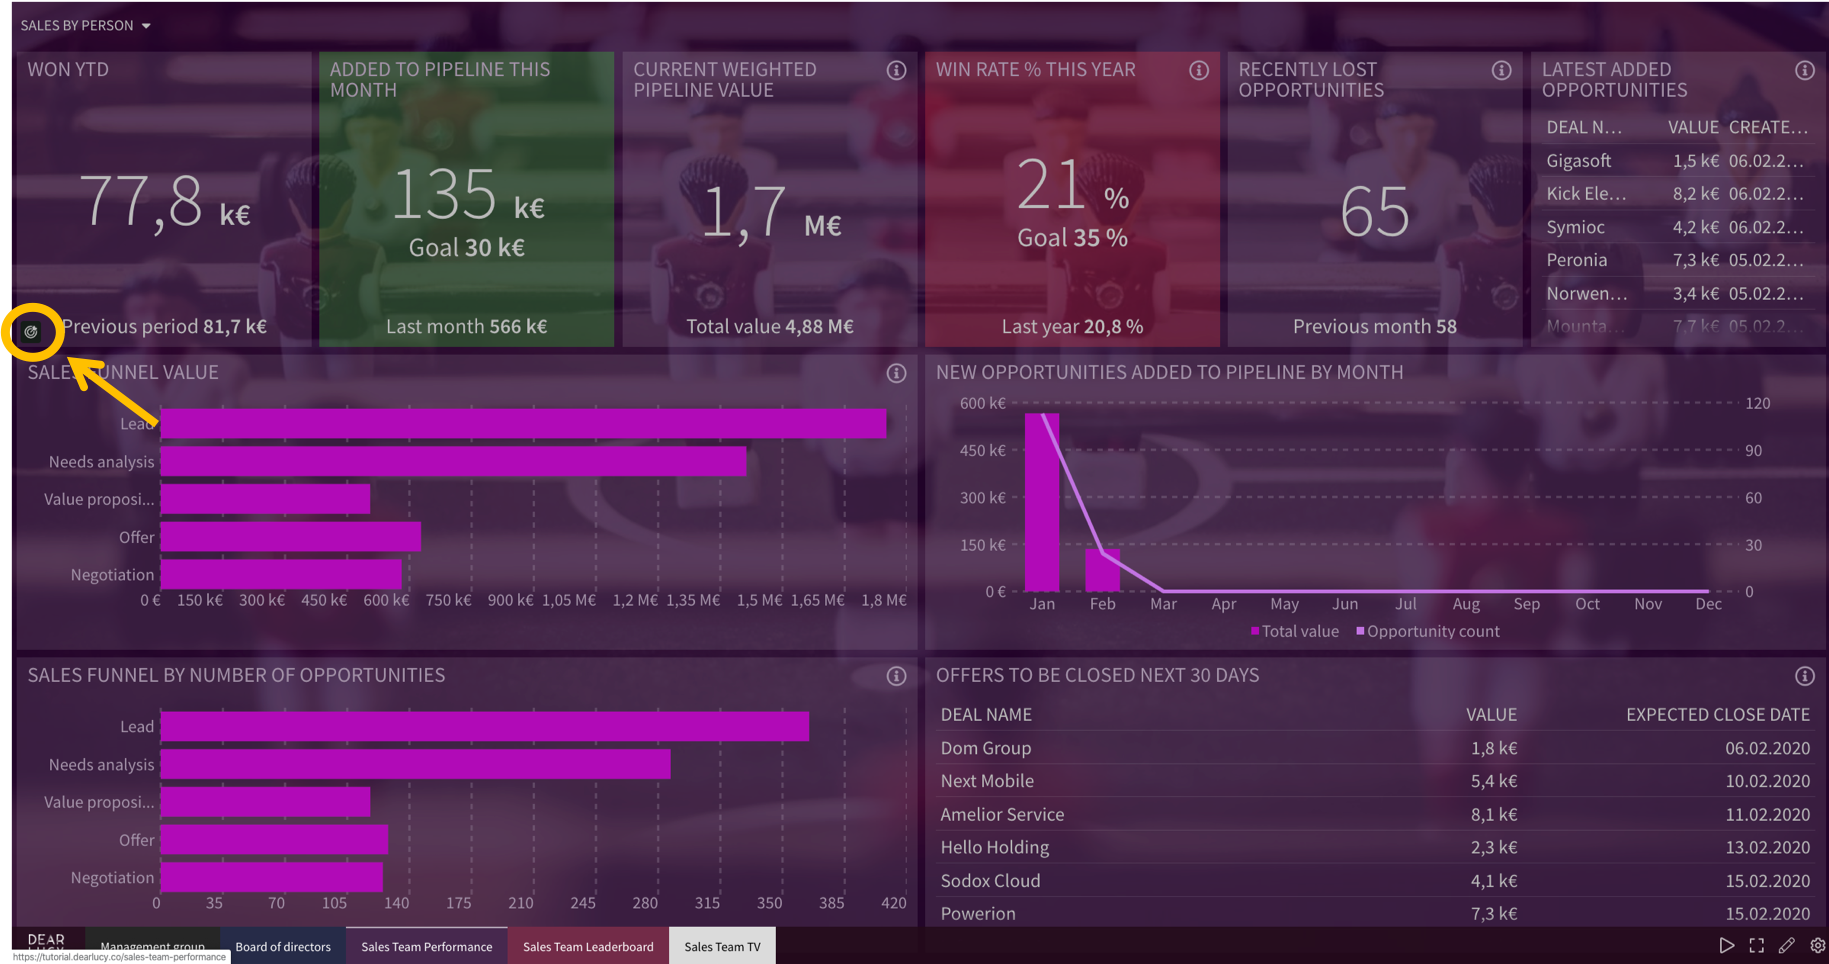
Performance against goals are visualized through lines in your charts or through color codes on your number widgets. The goal editor itself is a powerful tool that allows you to set goals for a number of different time periods, for different business dimensions and track whether you're on track to meet your goal at the end of the period.
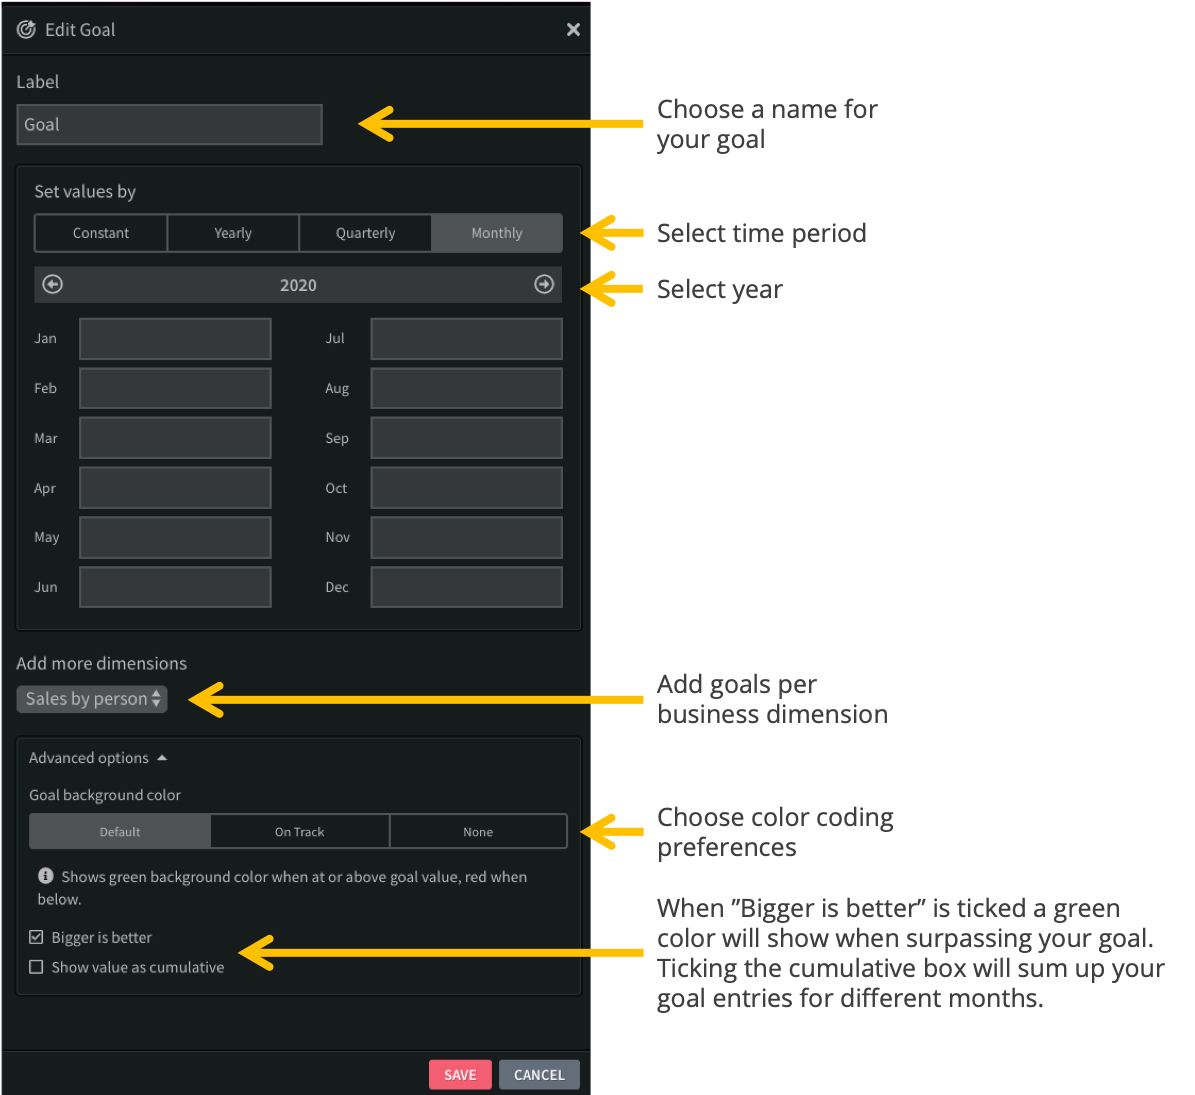
You can learn more about how the goal editor in another article by clicking here.
Add business dimension filters to your dashboard
Dropdown filters allow you to quickly filter data on the dashboard. Selecting a specific dimension will change all the figures on the dashboard to show only data for the selected dimension, or dimensions if you have several filters activated.
These filters are specifically useful if you want to see figures, for example, for a specific business unit or pipeline, or if you want to create a new dashboard which always only shows data of a certain deal type.
You can add dimension filters by following the steps below:
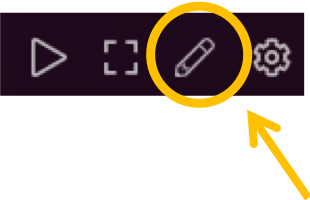
1. Click the pencil icon in the bottom right corner of the dashboard where you want to add dimension filters. This will take you to the dashboard editor of that specific dashboard.
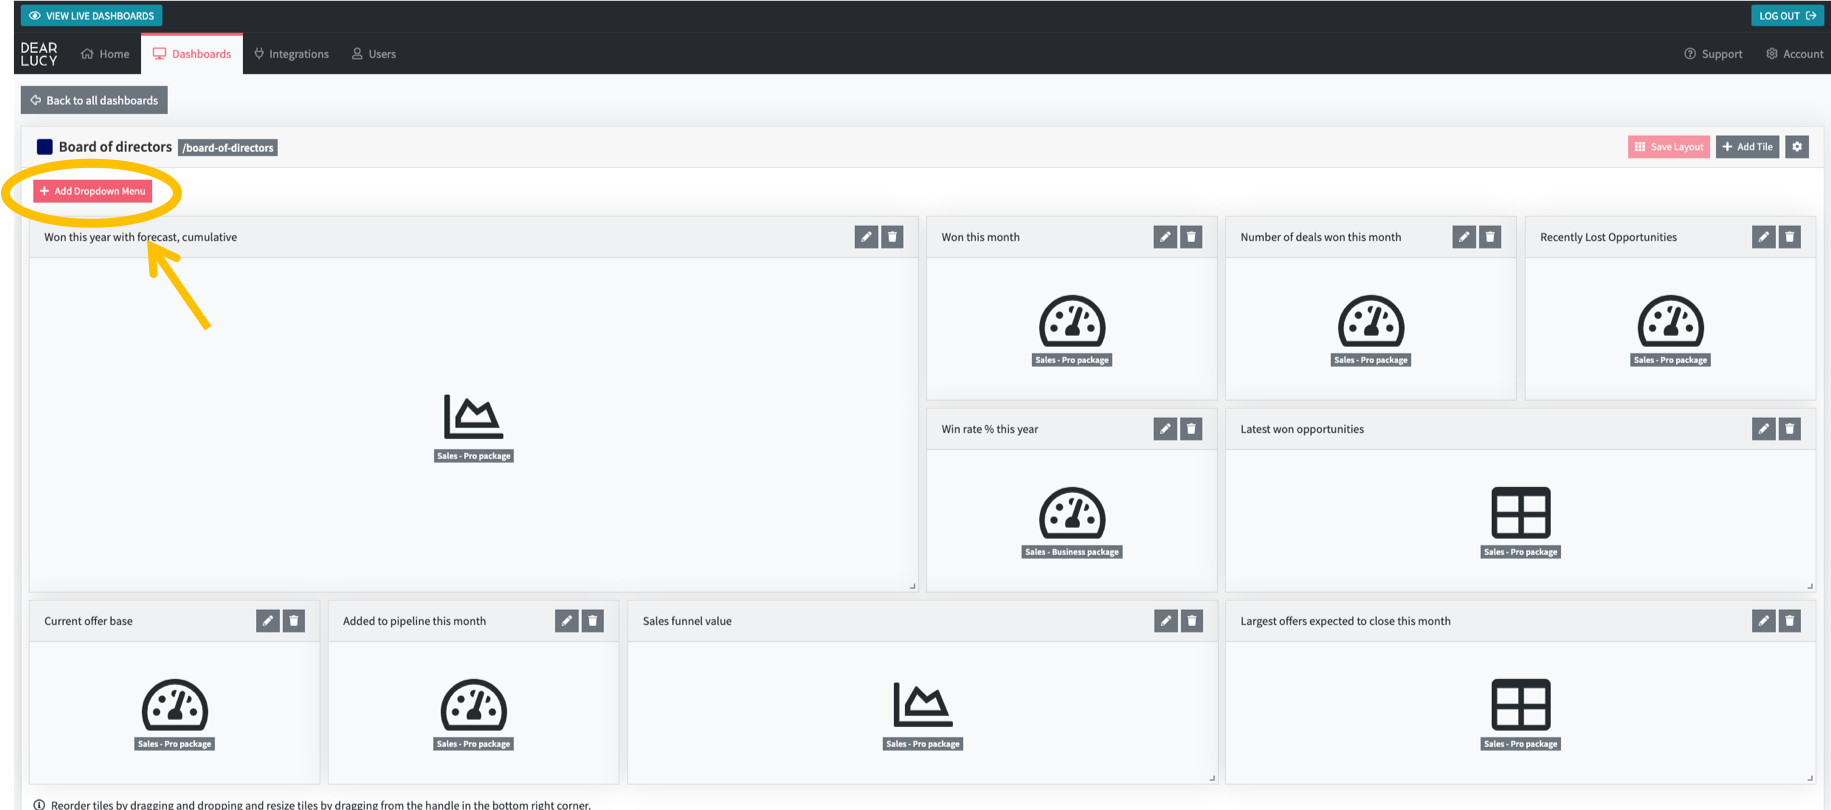
2. Click "+Add Dropdown Menu" from the top left corner.
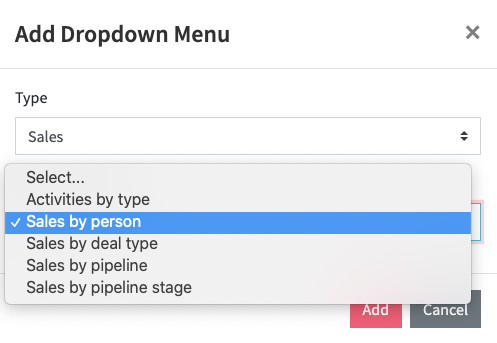
3. In this example we want to add a drop down for Sales by person. We select Sales in the first field called "Type" and then choose "Sales by Person" in the second field called "Dropdown Menu".
Dear Lucy offers a number of standard drop-down filters depending on your active integrations. For CRM integrations, you should always select "Sales" in the first field from the pop-up window. Remember to press save to add the filter.
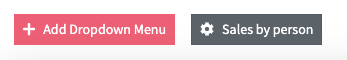
4. The dropdown menu will be visible in the menu on the top, next to the "+Add Dropdown Menu" button.
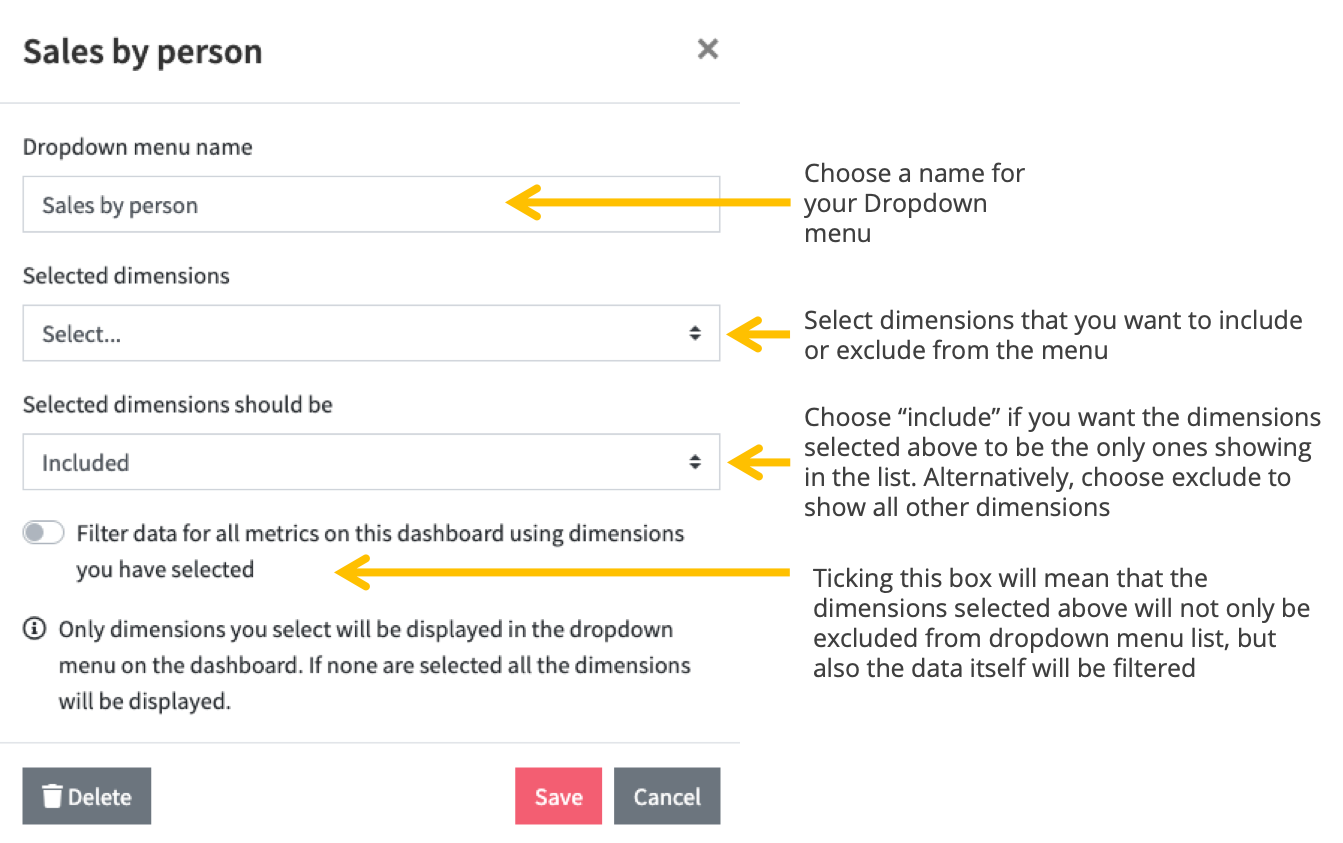
5. You can further edit the Dropdown filter by pressing the filter button, "Sales by person" in this case. You can change what's included in the menu, as well as configure the dropdown menu to act as a filter of your data. However, you can also leave it as it is, and it will perfectly as a dropdown filter for all your data.
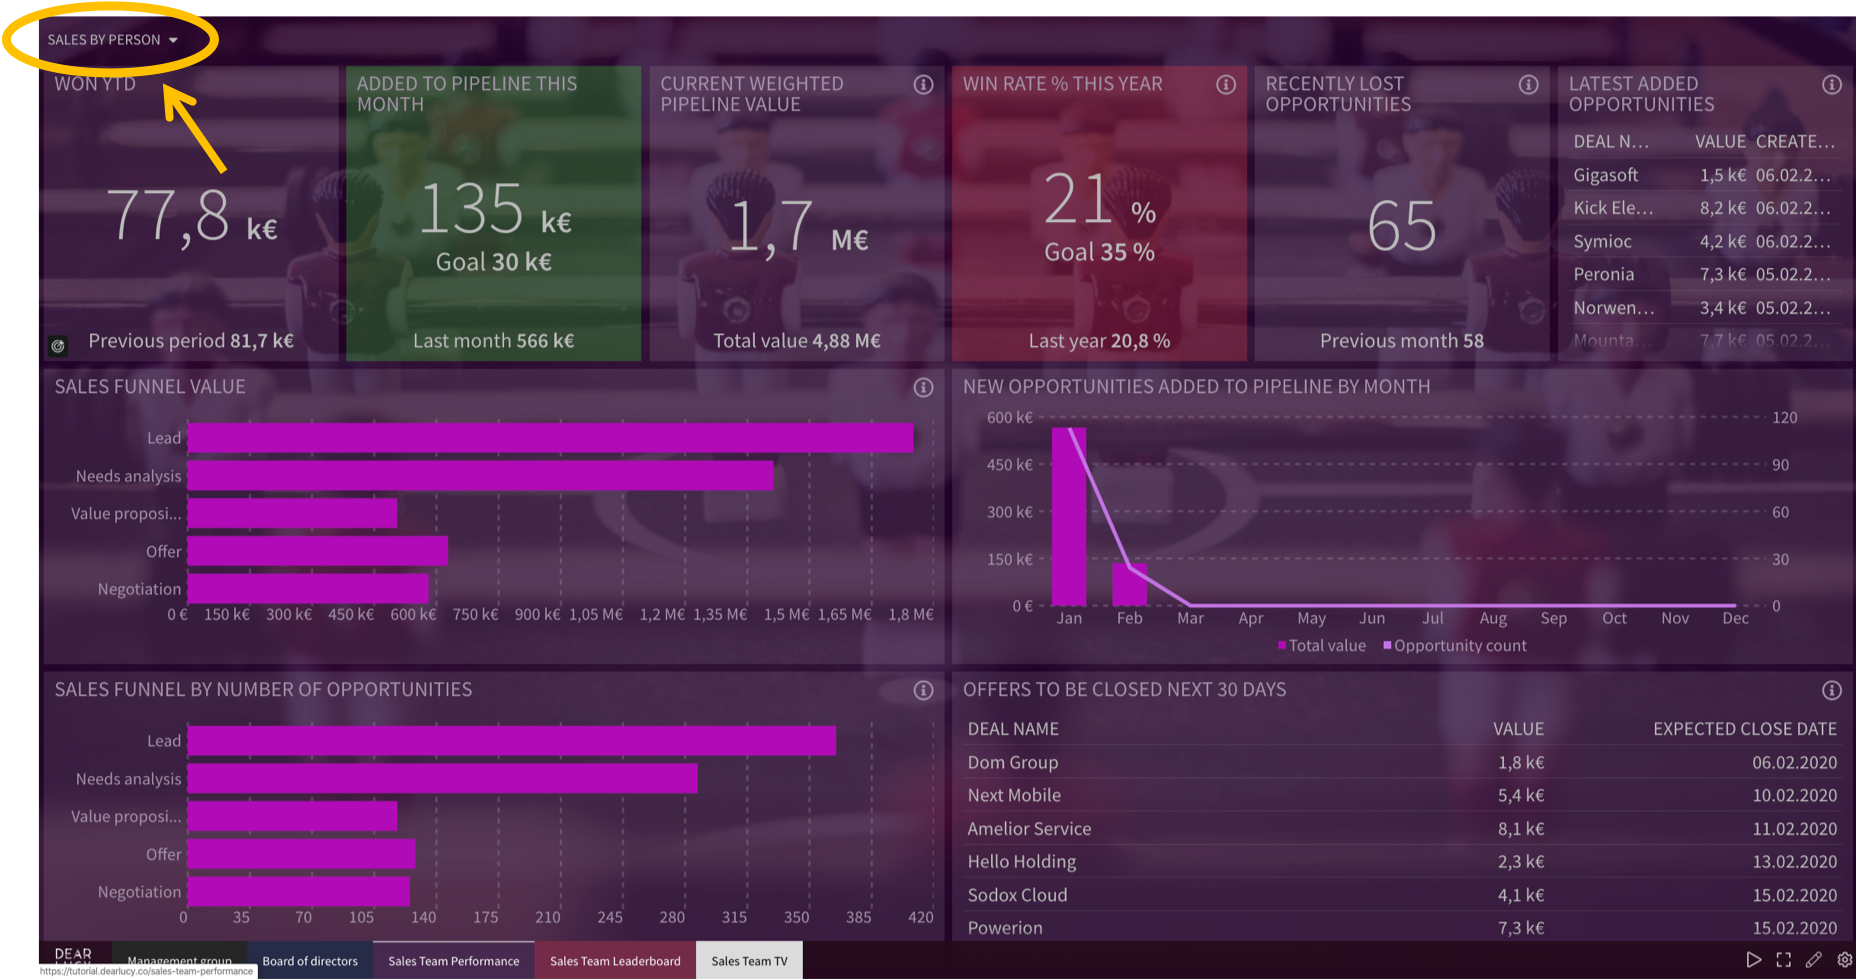
6. Return to your dashboard view to see the new filter in action. Added dimension filters will be shown in the top left corner of your dashboards.
Comments
0 comments
Article is closed for comments.