When you have successfully integrated your source system to Dear Lucy, you will instantly be provided with a set of predesigned dashboards with different metrics. Dear Lucy has designed these dashboards for our users based on how most of our customers interact with the dashboards.
For example, there's a dashboard for the management team and one dashboard that can be shown on TV screens, etc..
The prebuilt dashboards can be used straight as they are, but since no one size fits all when it comes to data we encourage all of our clients to build their own dashboards for specific user groups or use cases. With Dear Lucy, it takes only a few minutes.
This article will explain first how to customize and build your own dashboard, and then how to share it with a specific audience.
How to build your own dashboard
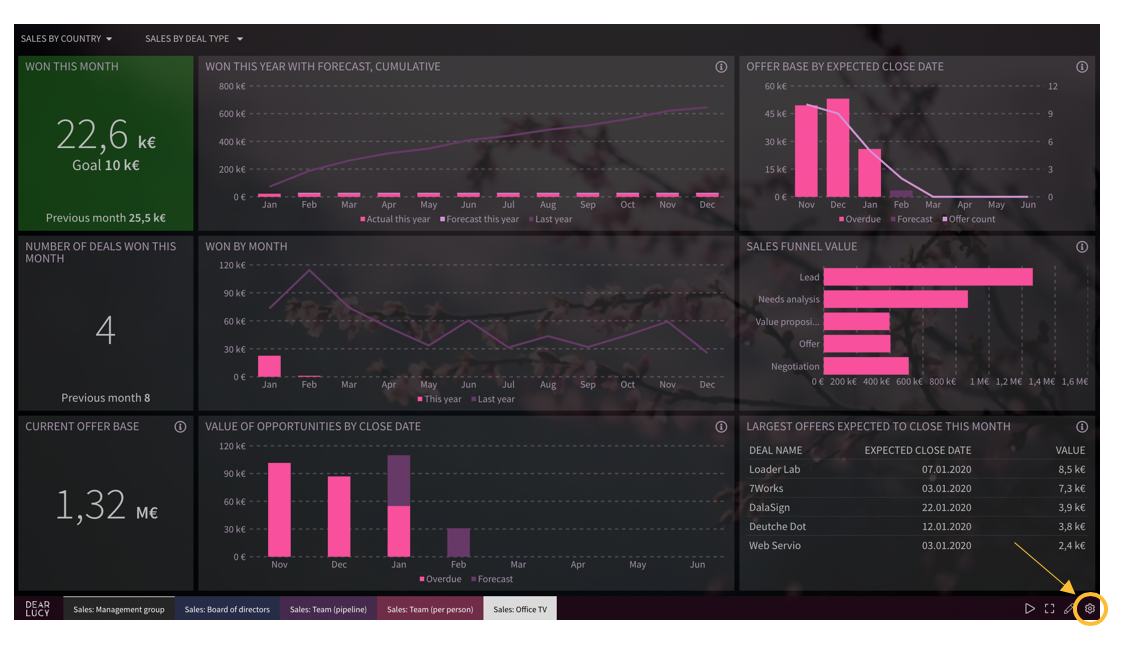
1. Access Settings by pressing the cogwheel in the bottom right corner.
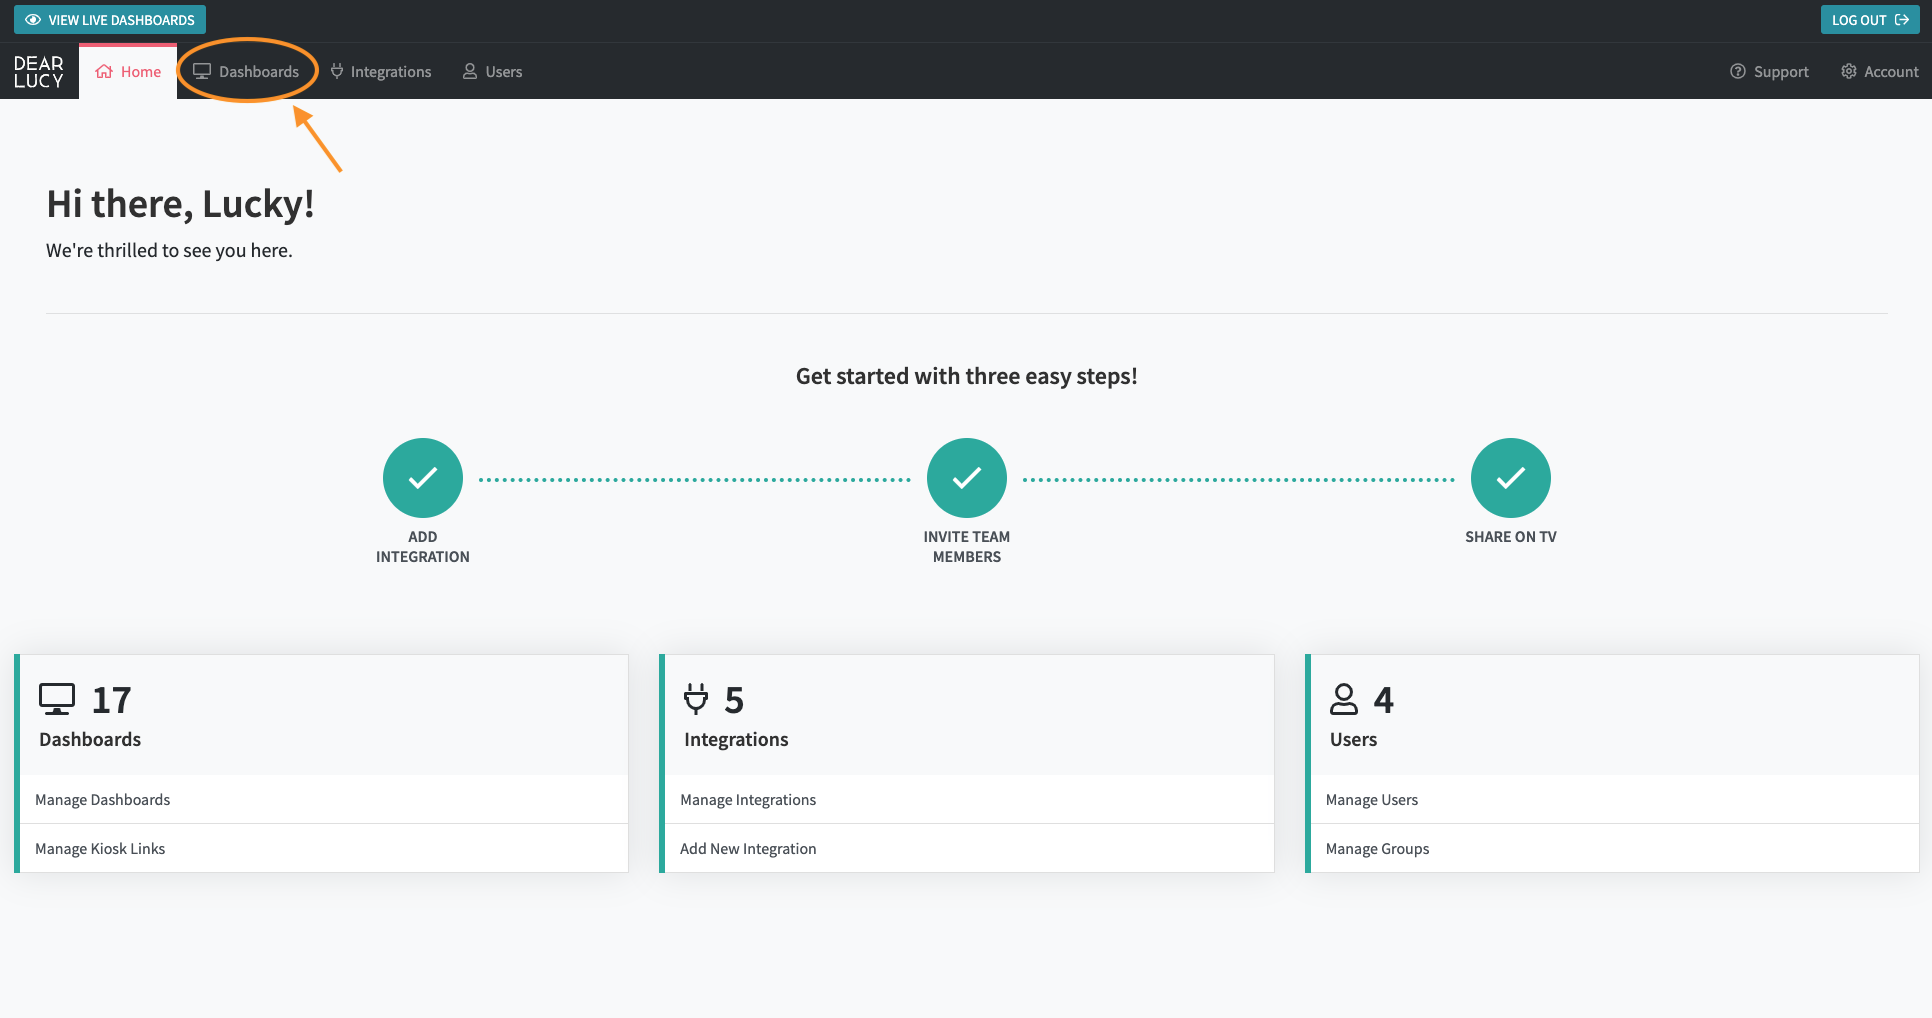
2. Once in the Settings home page, press the "Dashboards" button from the menu on the top.
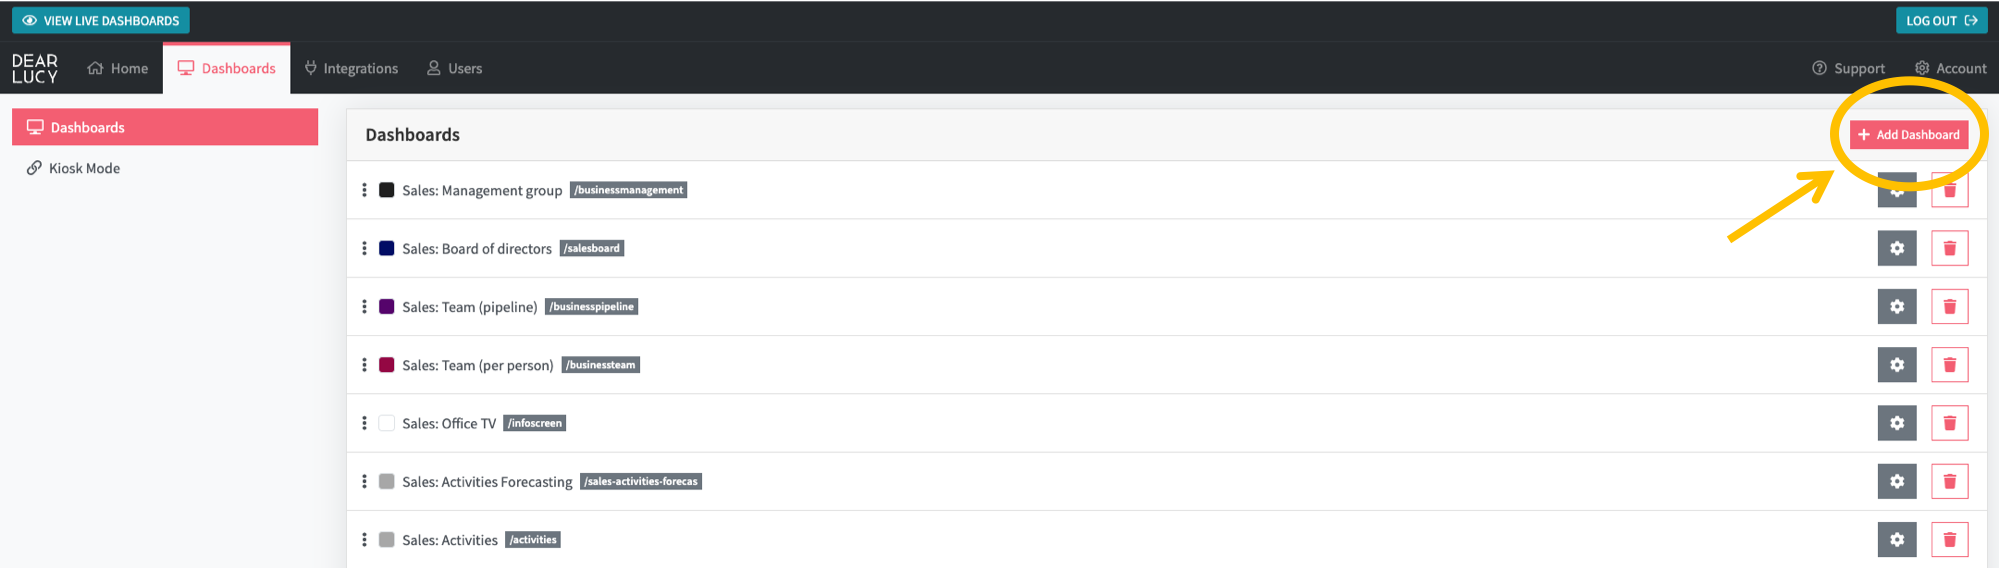
3. Press "+ Add dashboard" from the top right corner.
4. A pop-up window will appear where you can choose a title, color theme and background picture for the new dashboard. If you're creating a dashboard for the purpose of a monthly management team meeting, you can e.g. call it Management meeting, and choose a background picture with a logo of your business.
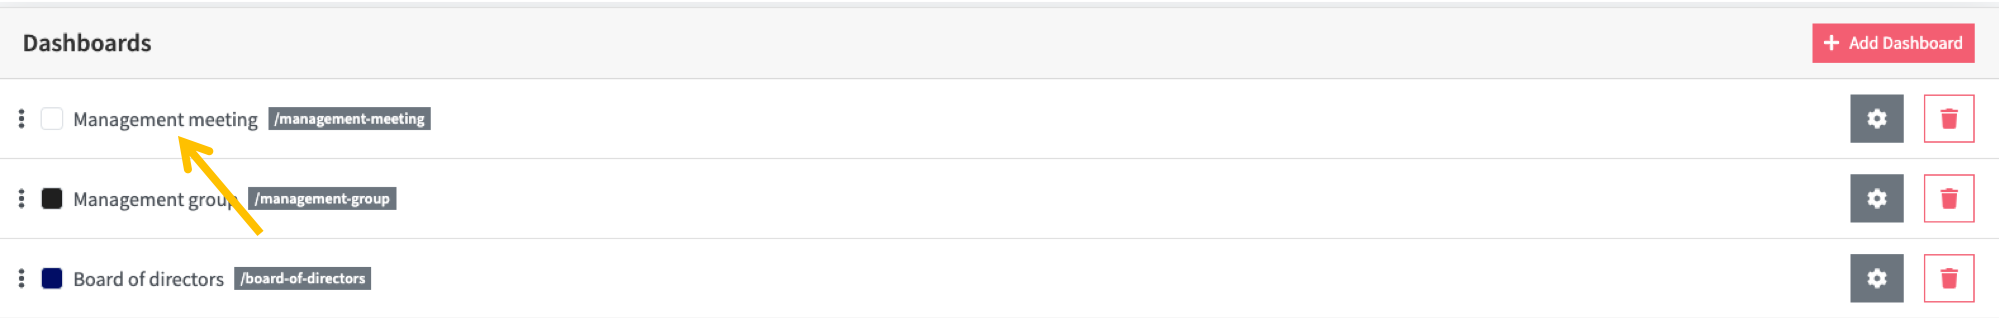
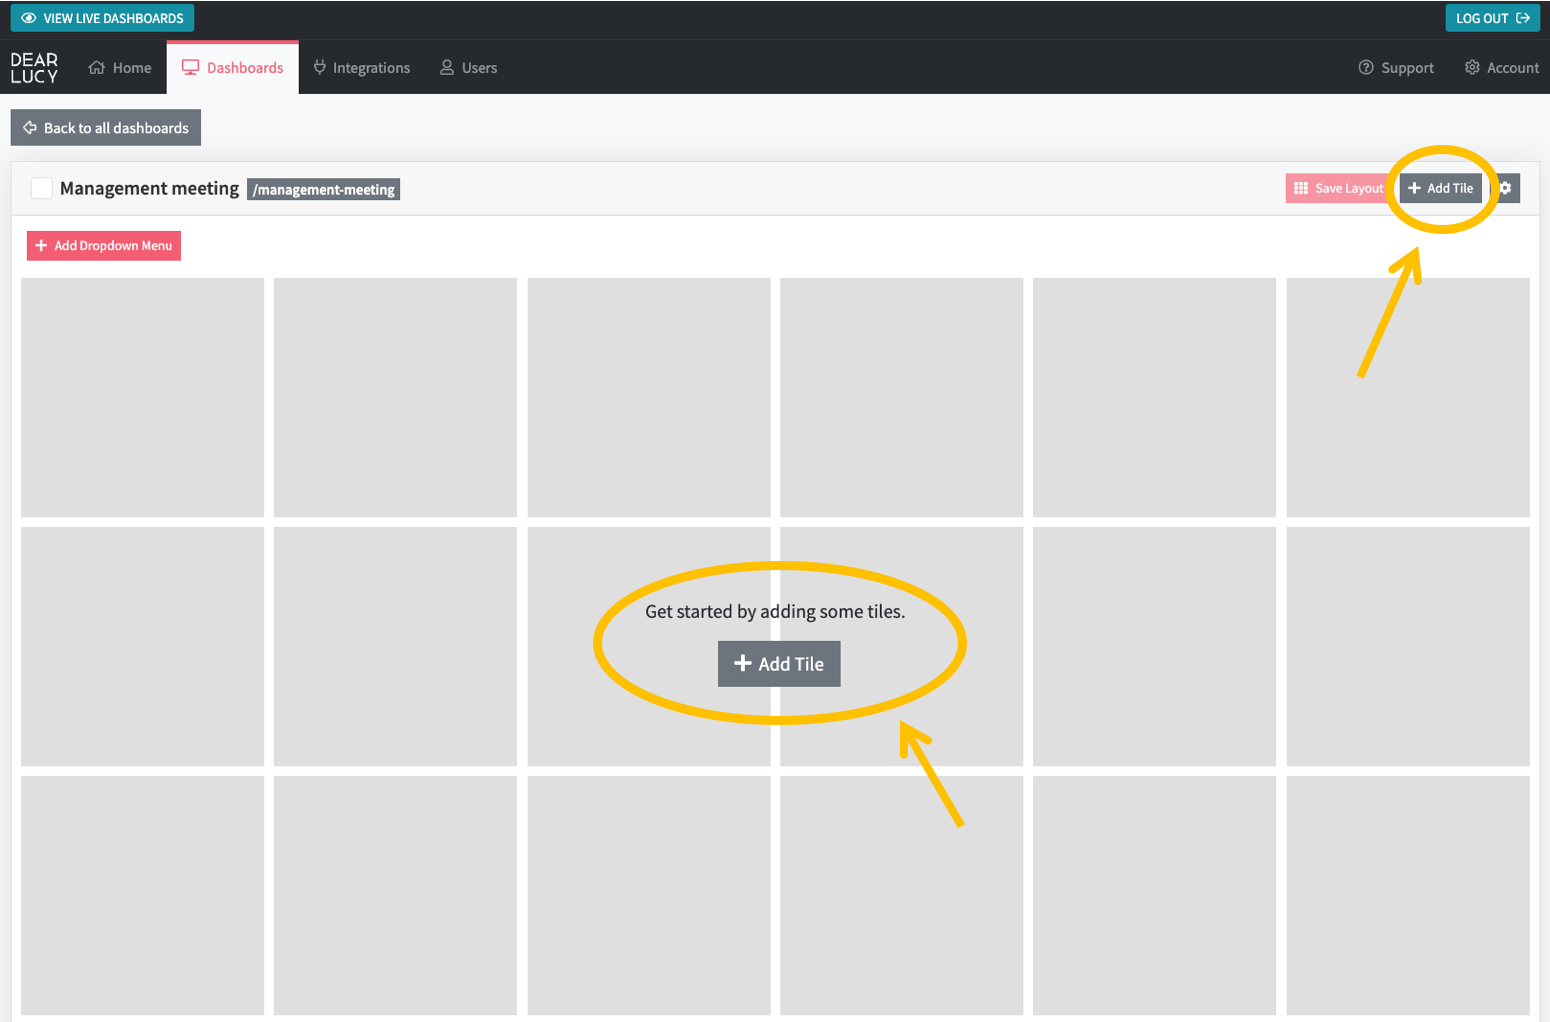
5. The new dashboard will show up in the list of dashboards, click it to enter the dashboard editing view.
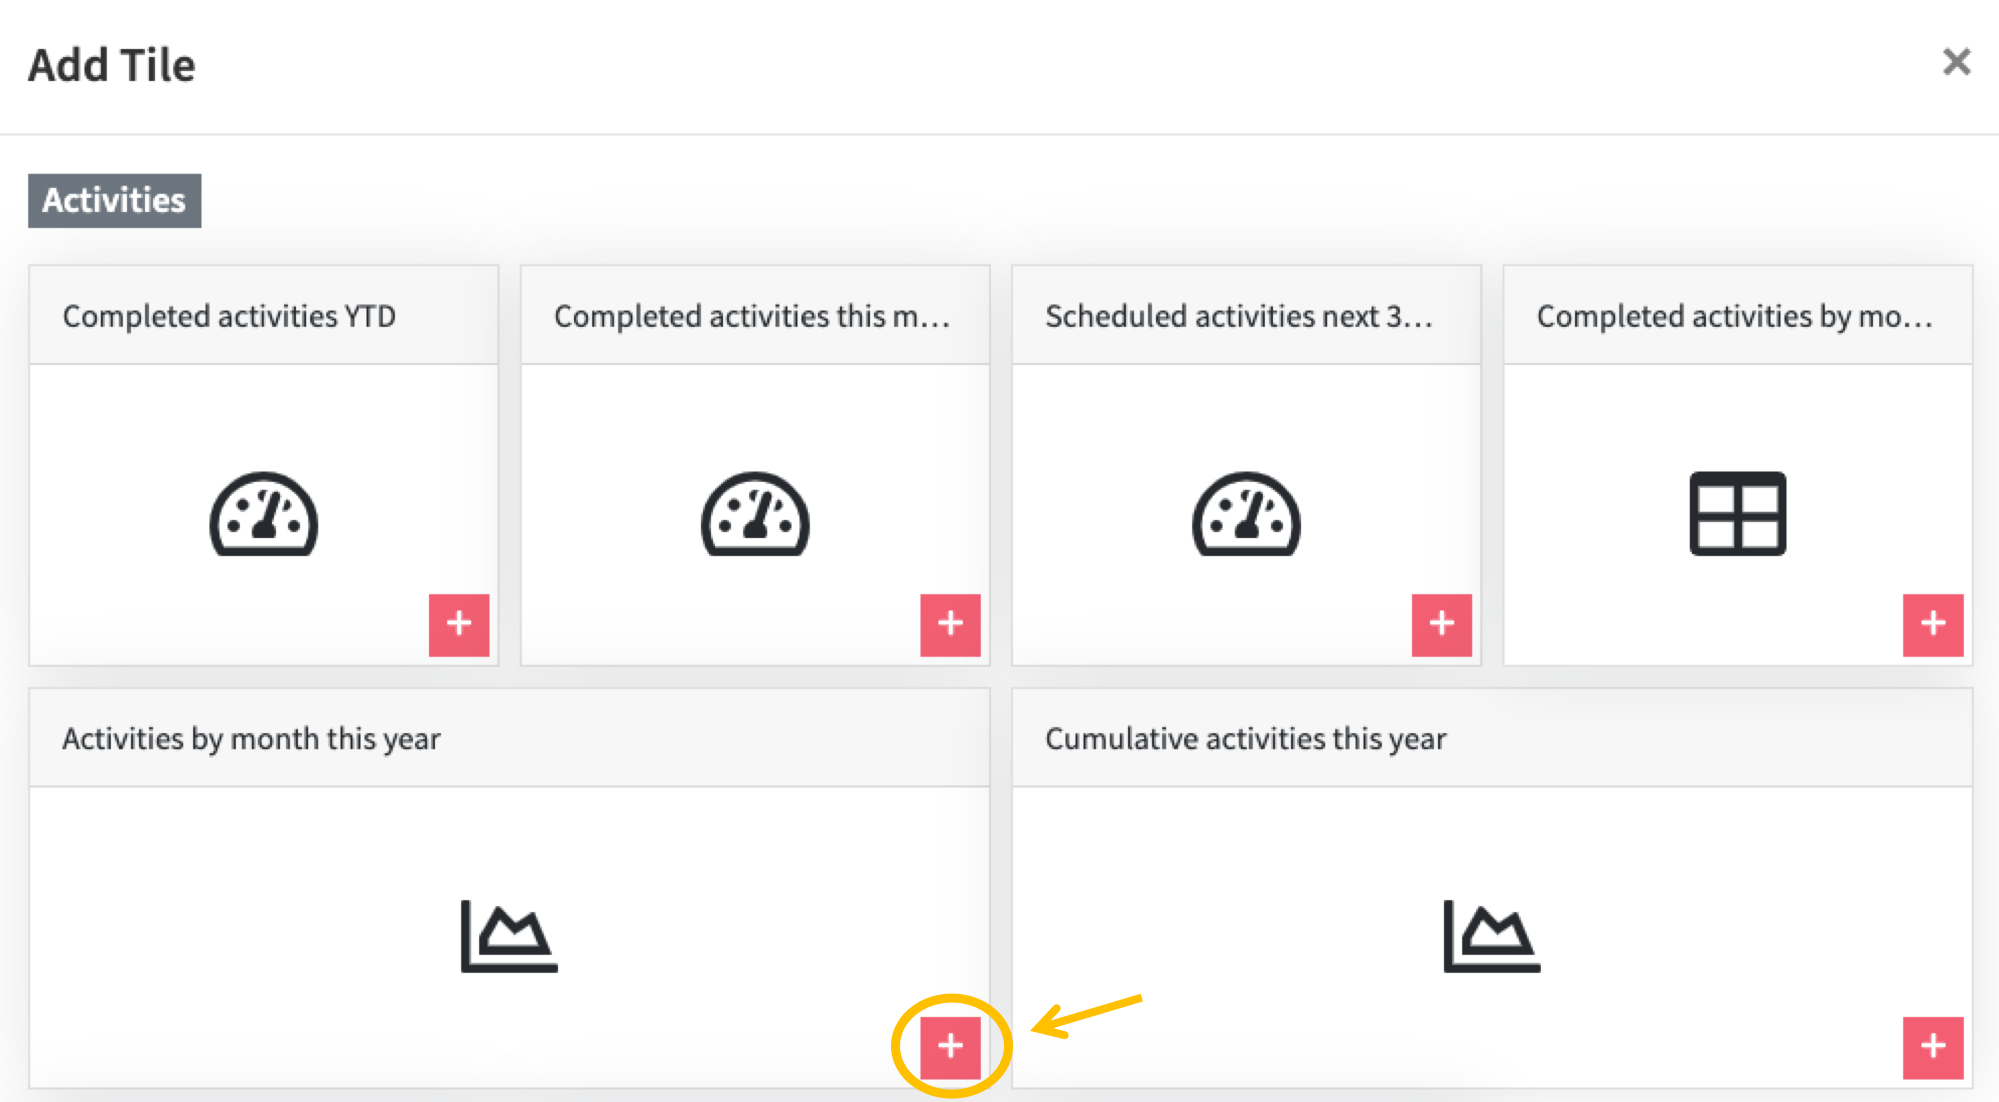
6. Press "+ Add Tile" to access your library of available metrics and KPIs. If you have more than one integration running, the metrics are organized by integration and you can combine metrics from different integrations to the same dashboard. Press the plus sign on the metrics that you want to follow up on in your management team meeting.
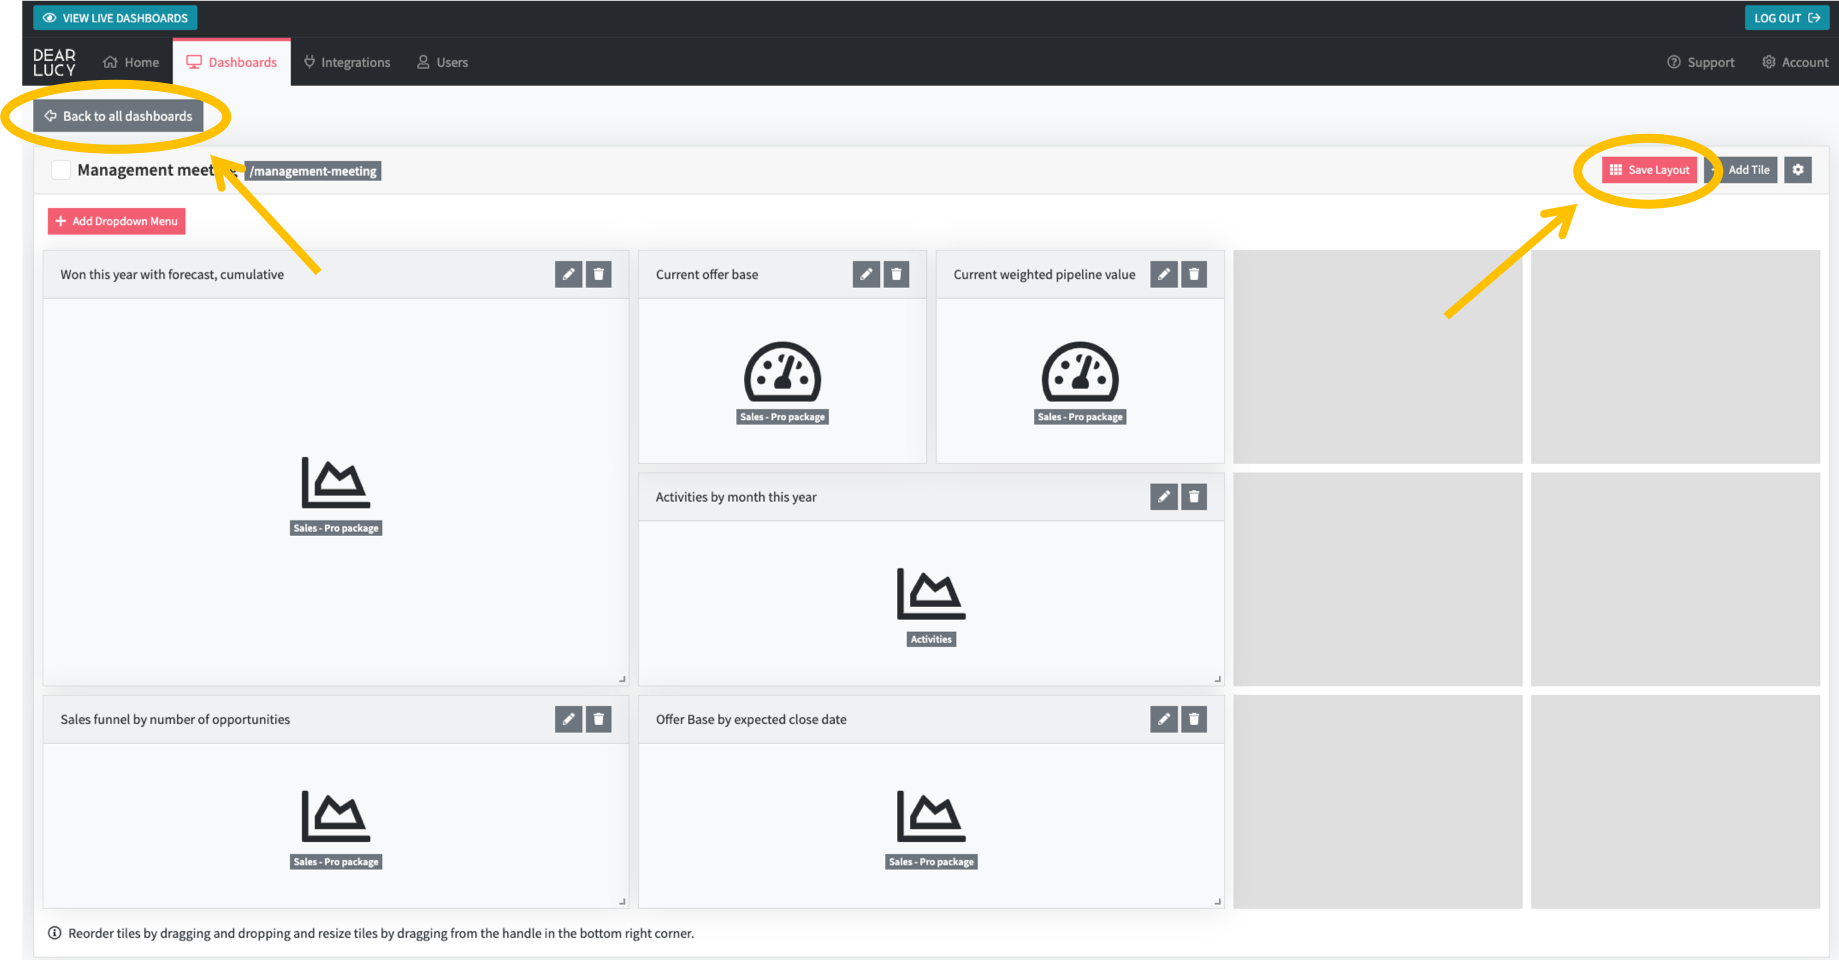
7. Once you have selected your preferred metrics for the management team meeting, remember to press "Save Layout" to save your changes. Then press "Back to all dashboards" to access the full list of your dashboards.
Please note: If you have created your own user groups, the newly created dashboard will not be visible to anyone until it has been assigned to a User Group. If you have not created any User Groups it will be automatically added to the default group "Public" and will be visible to all users in that group.
Share the new dashboard with your management team
When you have created your new dashboard it is time to share it with the rest of the management team. There are a couple of steps involved in sharing a dashboard with a specific user group; i) Creating a Group and ii) Inviting Users to the Group.
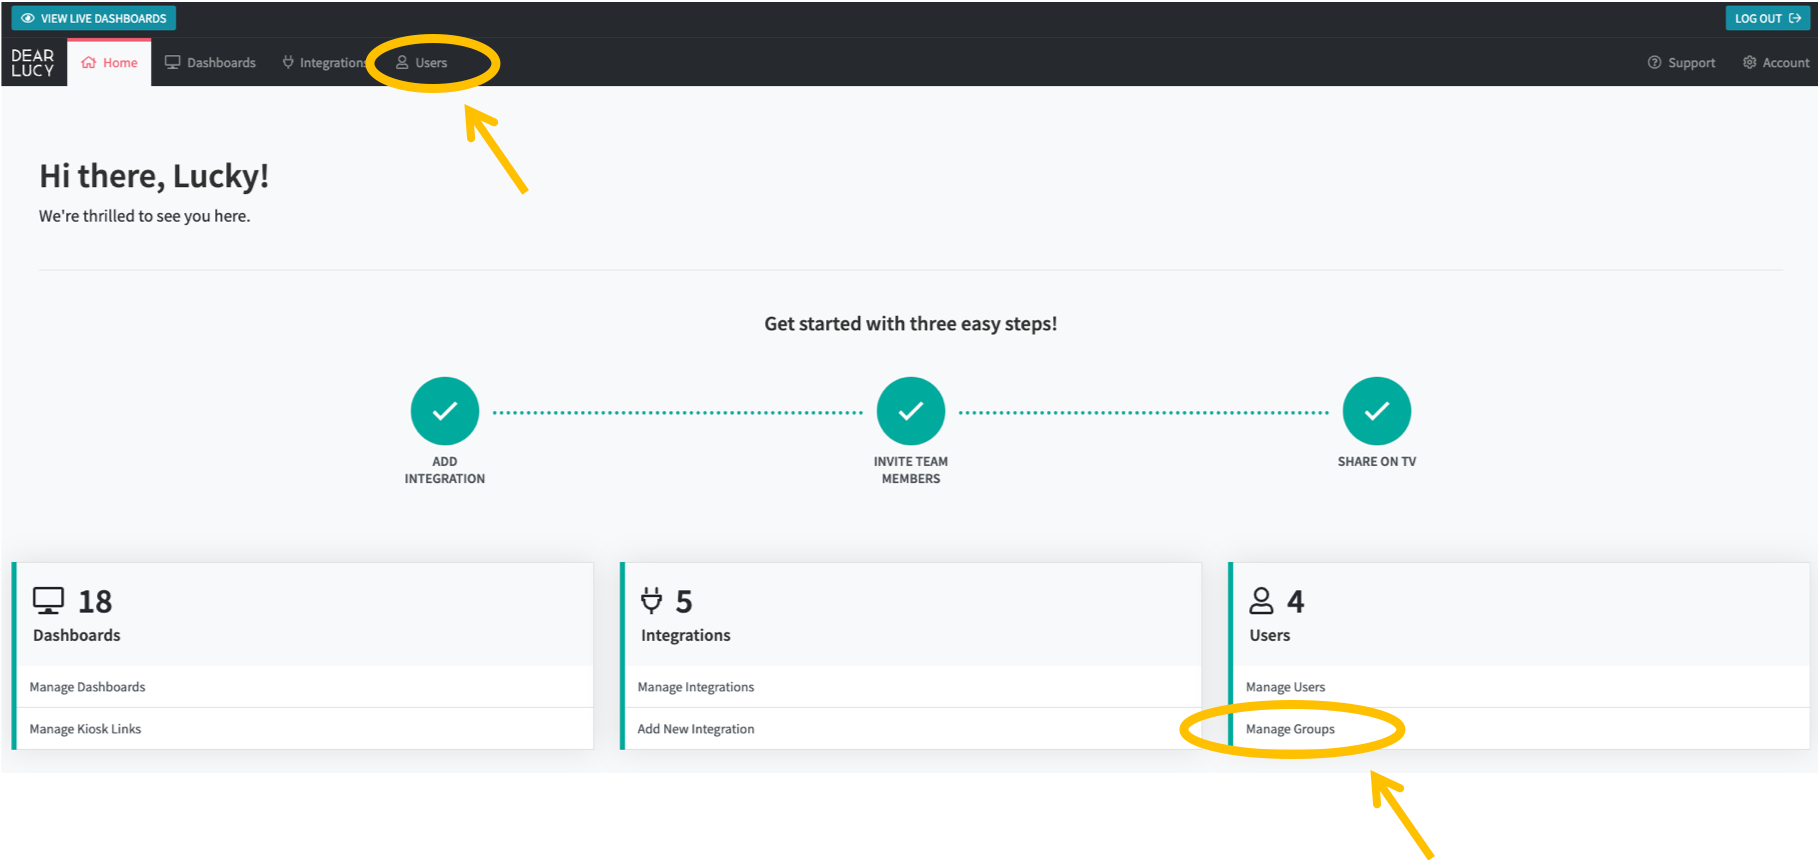
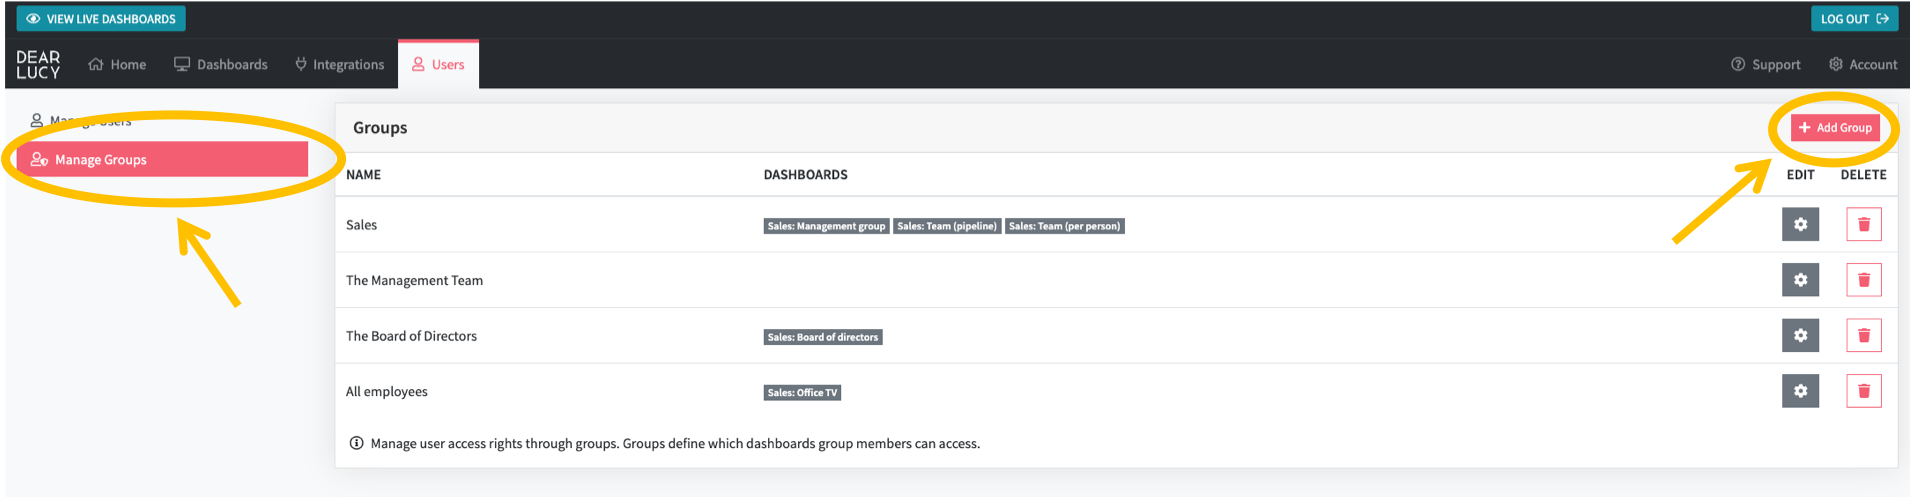
1. From the Settings Home screen, click "Users" from the menu or "Manage Groups" from the quick link.
2. Click "+ Add Group" in the top right corner from the Manage Groups view.
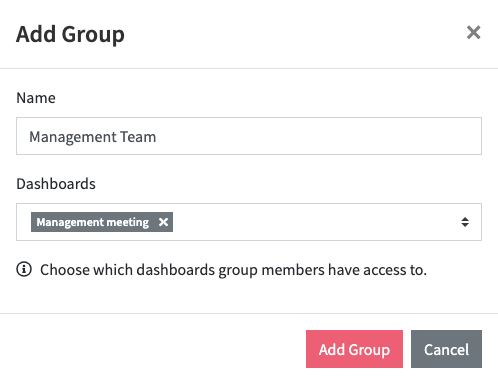
2. A pop-up window will appear where you can name your group, and select which dashboards that are visible for Users in this group. In this case we select our newly created dashboard called "Management meeting" and we name the group "Management Team". Click "Add Group" to save the group and return to the Manage Groups view.
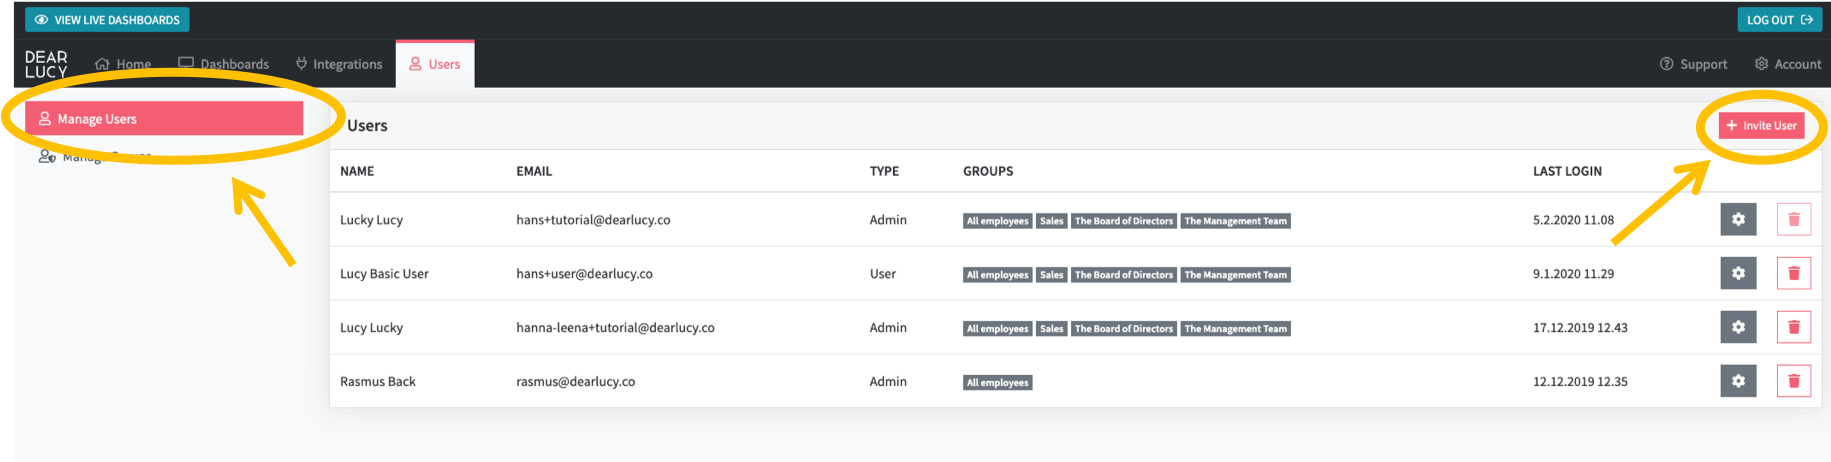
3. The next step is to invite Users to the new Group. Go to "Manage Users" and press "+ Invite User" in the top right corner.
4. A pop-up window will appear where you need to enter the your team members' name, email, user type and select which Group the User will belong to. In this case we will select the newly created group "Management Team", which has access only to one dashboard, the "Management meeting" dashboard.
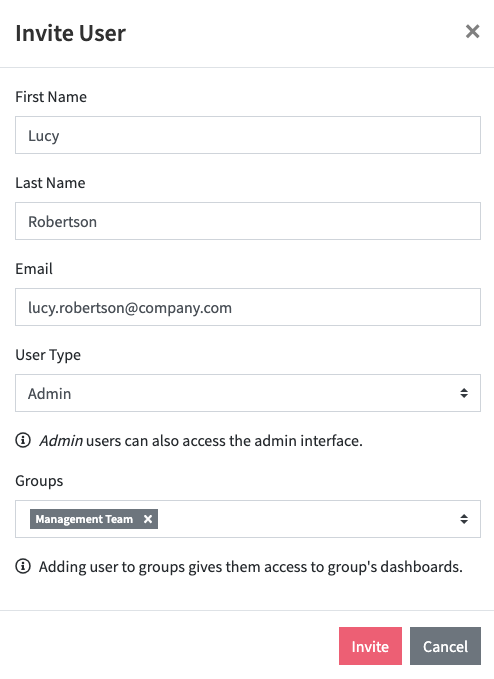
"User Type" determines whether a User will be an Admin or a User. The difference between being an Admin and a User is that Admins can access Settings and all the features within Settings, whereas a User will not be able to access Settings.
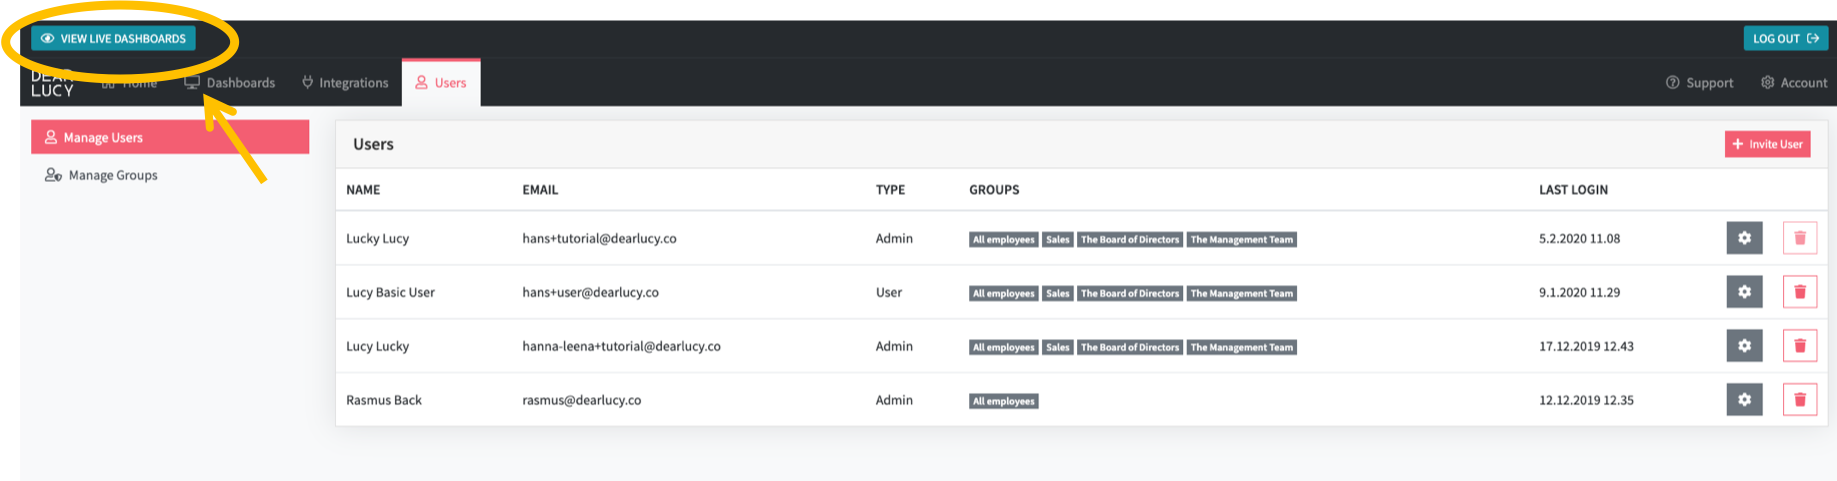
5. Repeat the steps above for your whole management team so that you all have access, but you can of course return to the live dashboard view to have a look at the dashboard created for your Management team meetings by clicking the green "View live dashboards" button.
Comments
0 comments
Article is closed for comments.