Our Financials dashboard provides a quick overview of the core financial figures of your business – in a format that is easy to share and communicate across the organization.
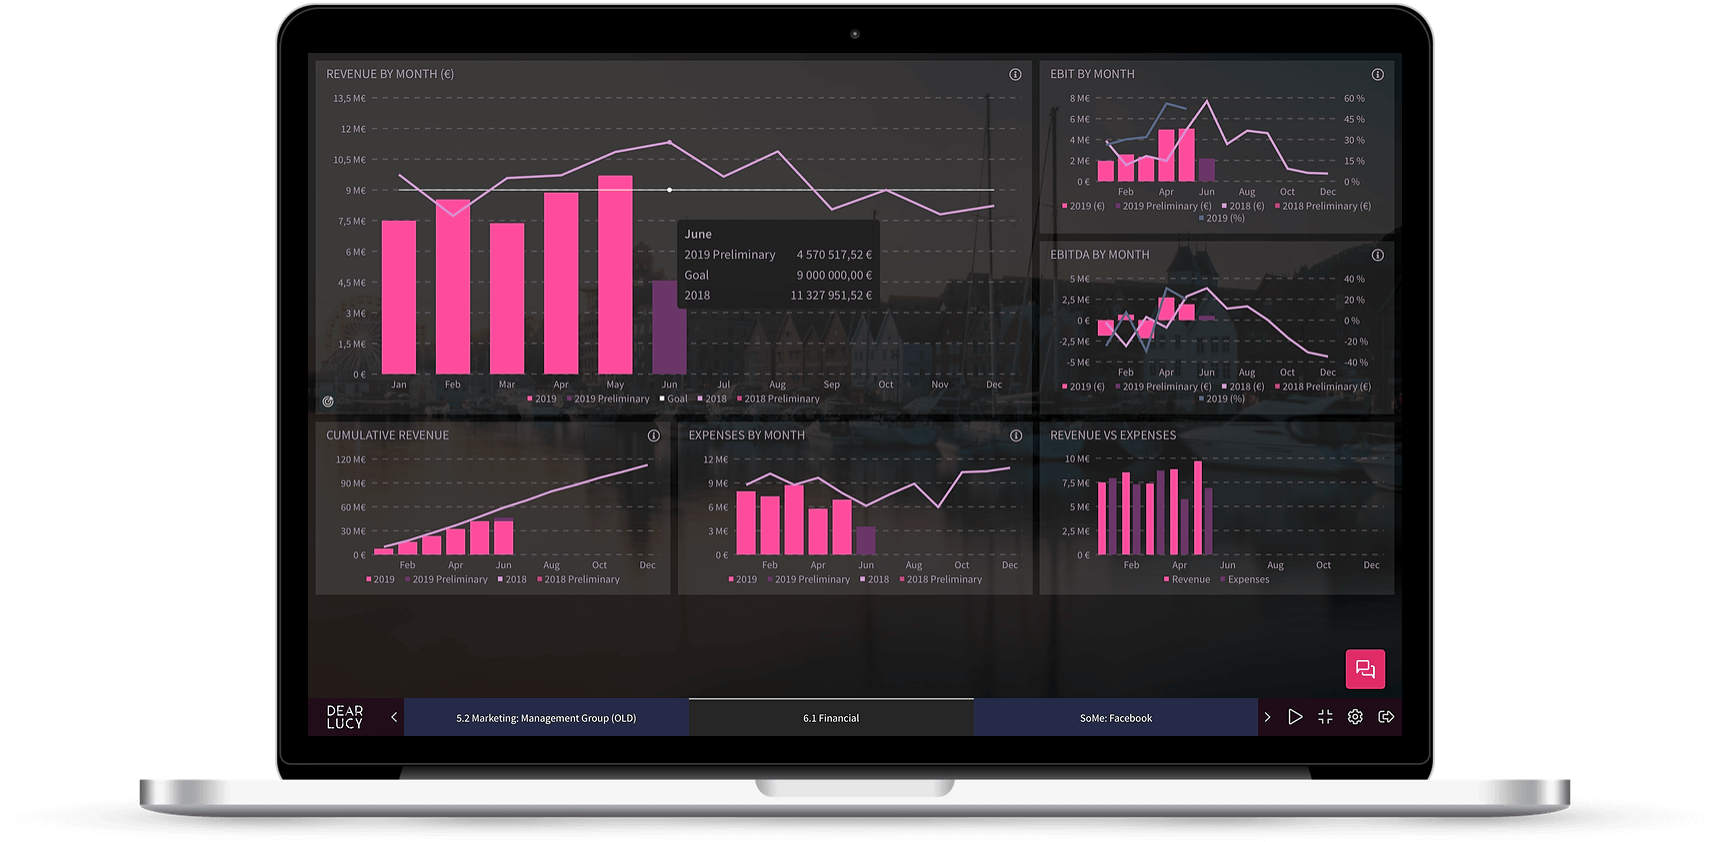
The dashboard reads real-time account-level data from your accounting systems and calculates the numbers based on modifiable account ranges.
The dashboard includes the following key numbers:
- Monthly revenue (both confirmed and preliminary figures)
- Cumulative revenue
- Monthly revenue vs expenses
- EBIT by month
- Cumulative EBIT
- EBITDA by month
- Cumulative EBITDA
Graphs on dashboards
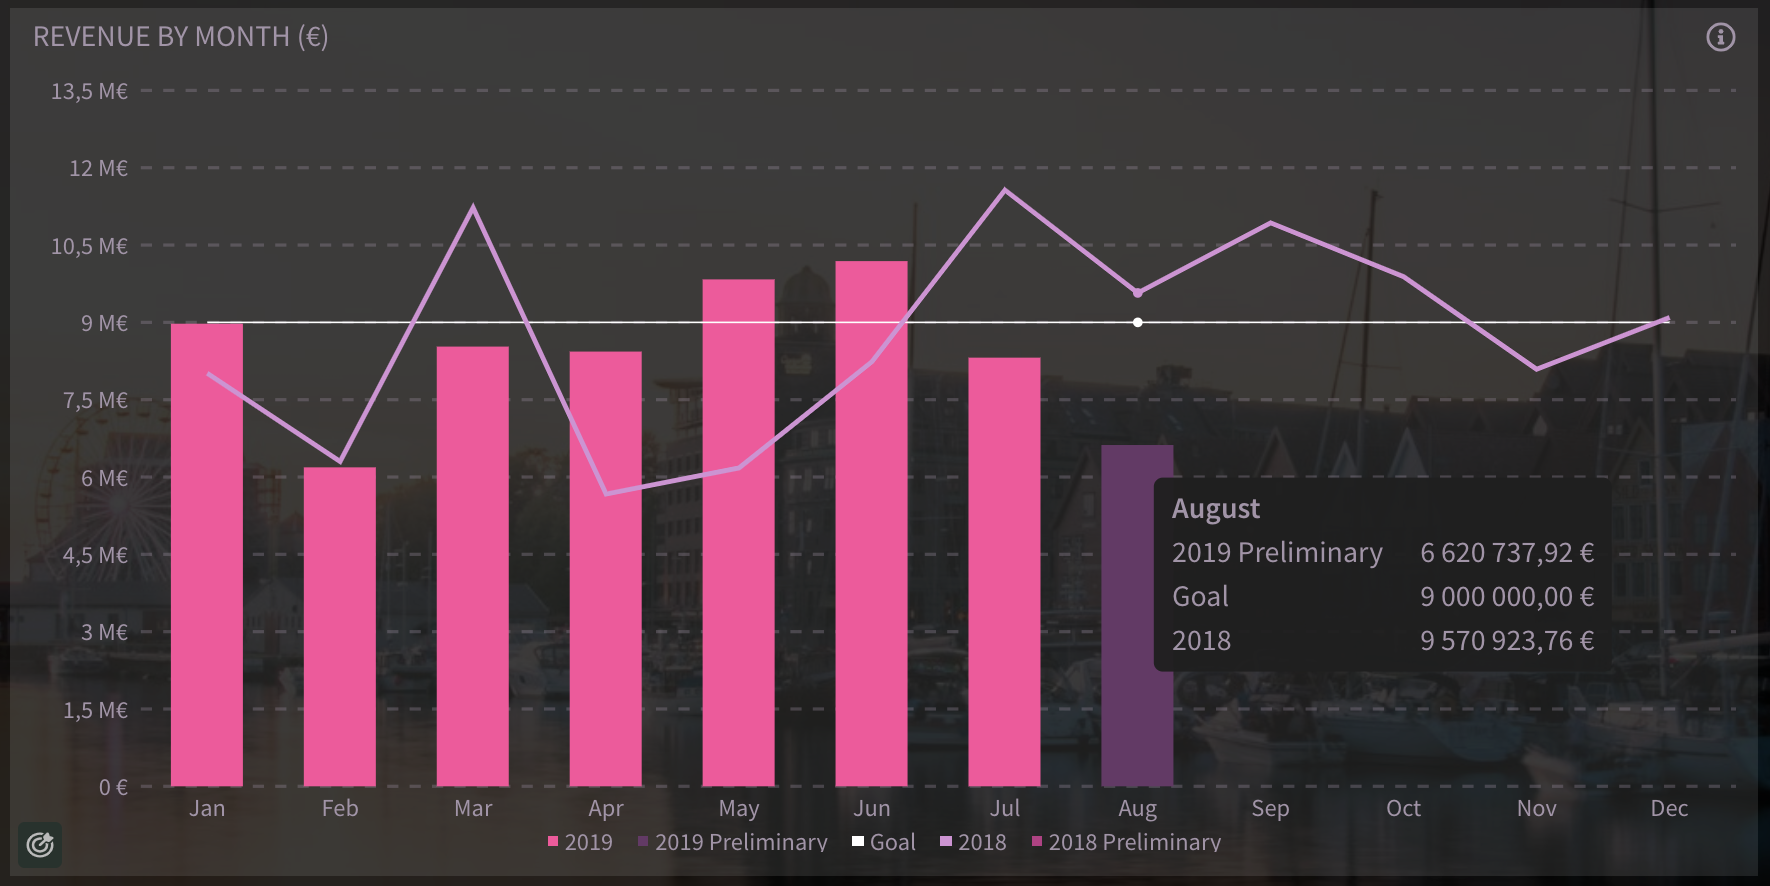
The graphs show your monthly figures for this year (both confirmed and preliminary periods), last year's figures and also your goals if you have defined goals in Dear Lucy.
Drill-downs show account-level data
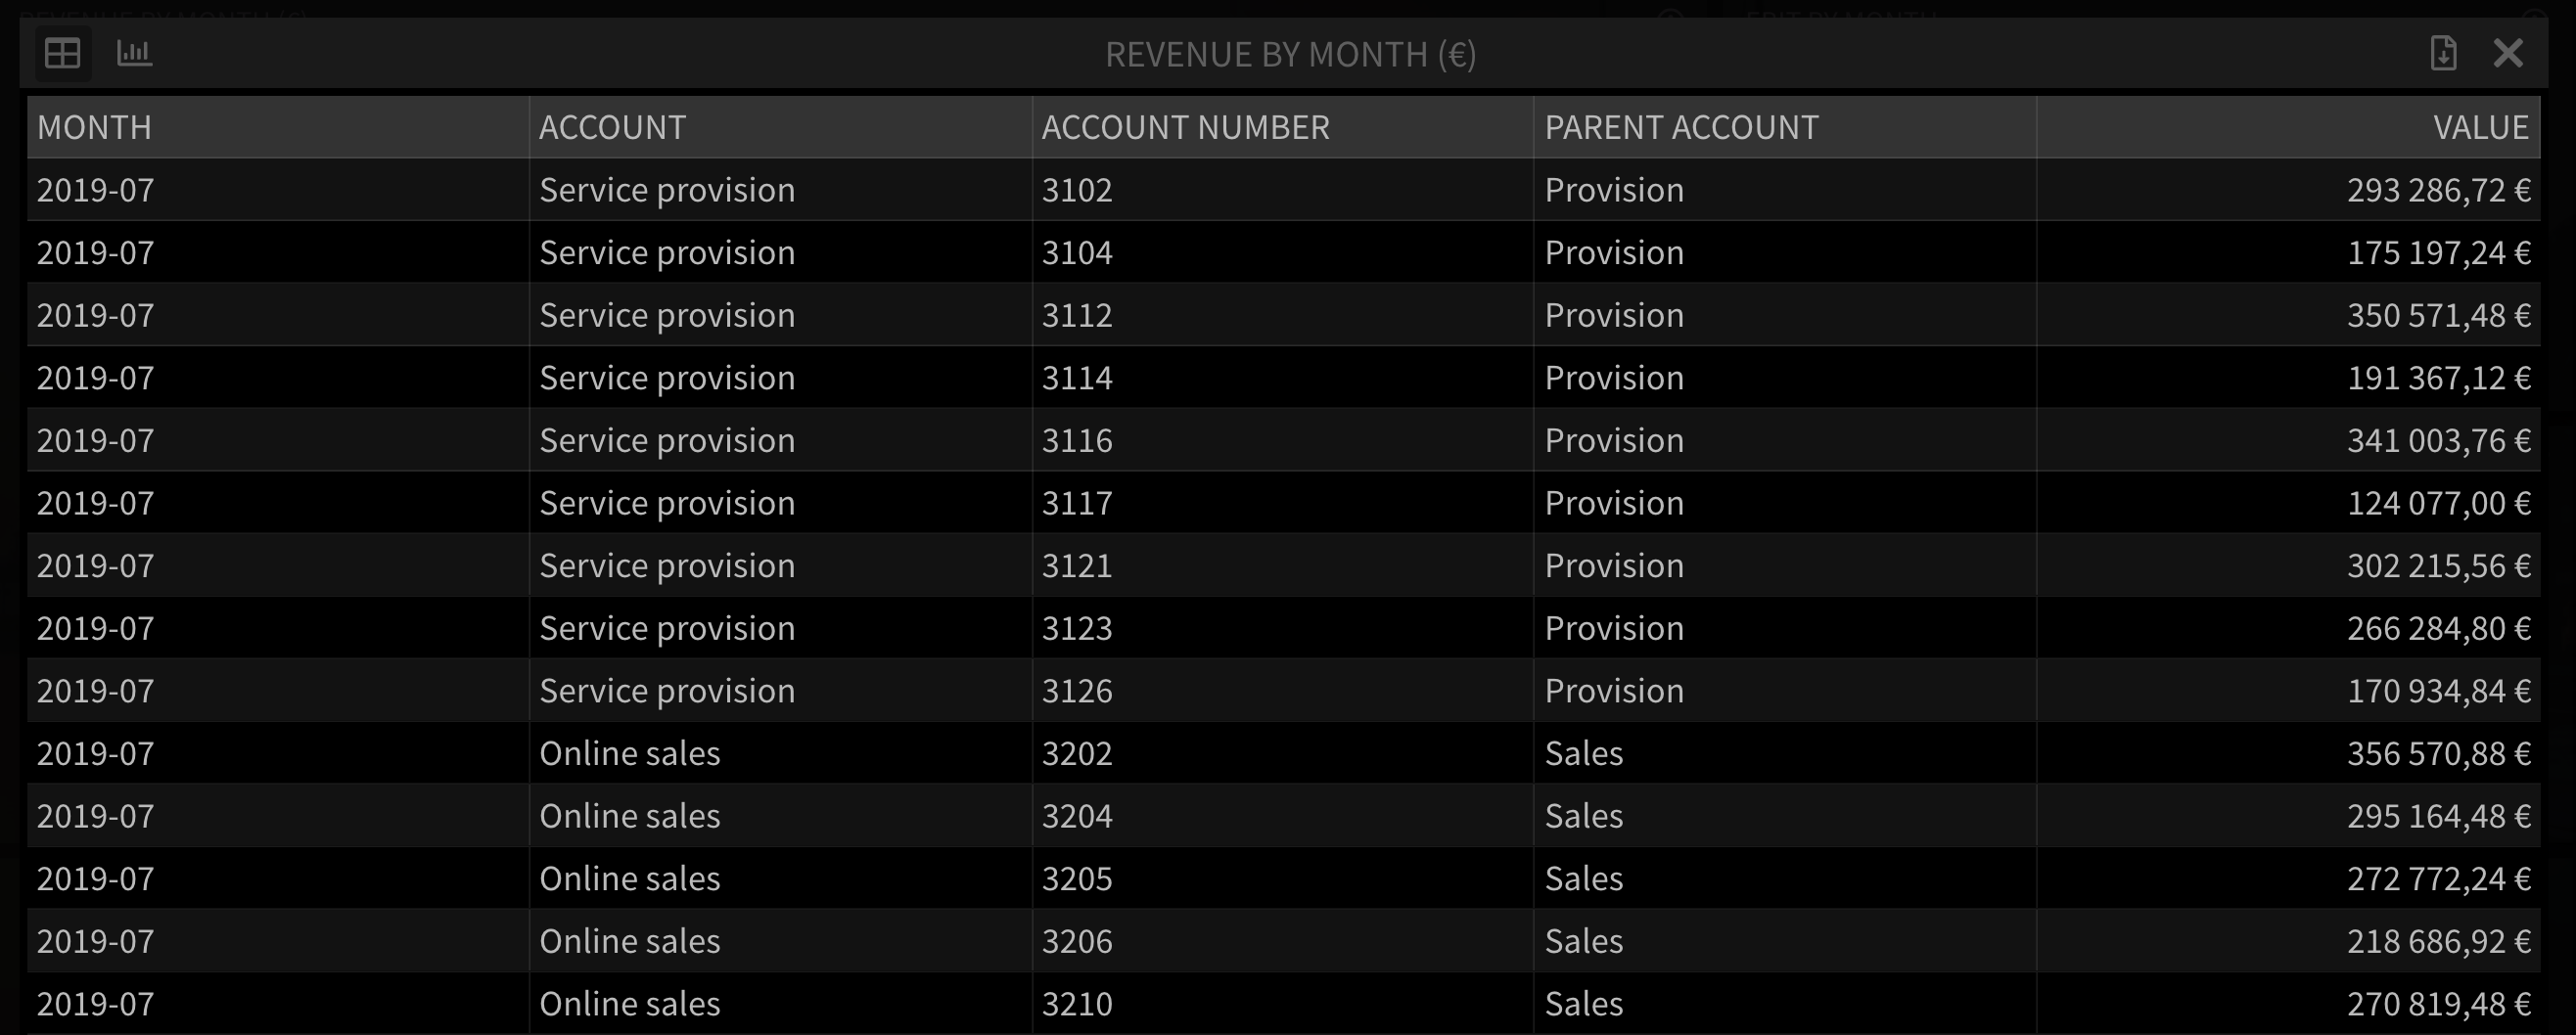
The dashboard is based on account-level data and clicking on the graphs reveals account-level details behind the numbers.
Available integrations
The dashboards are currently available for the following accounting systems:
Comments
0 comments
Article is closed for comments.