Dear Lucy supports Google Sheets integration, as long as it is tied to a concept or metric
If you are new to Dear Lucy, you first need to sign-up to proceed with the integration.
In order to add a metric, or even create a full dashboard from a spreadsheet, you first need to define the metric and what type of visualization you would like to see. The steps to successfully add a spreadsheet metric are as follows:
- Choose what metric(s) you would like to add
- Choose how you would like the metrics to be displayed on the dashboards
- From Dear Lucy's templates, fill in your data
- Share the file with Dear Lucy
1. Choose your metrics
With spreadsheet integrations you can get any metric up on a Dear Lucy dashboard, as long as it is value based.
We recommend that you start off with relatively simple metrics. In most cases the data will be manually updated and the more complex the metric, the more work to update it.
Please note that Dear Lucy dashboards are designed to show you trends and progress. Metrics should therefore preferably be measurable over time and you should ideally also fill in historical values for your metric.
The amount of data is restricted to 10,000 rows by default.
2. Choose how you want to visualize the metric
The most common types of visualizations are listed below, but we also support additional visualizations if none of the examples below will suit your need.
Bear in mind that you also need to define the time-range of the metric. Would you like the figures to show monthly values, or cumulative this year by month, or weekly?, etc..
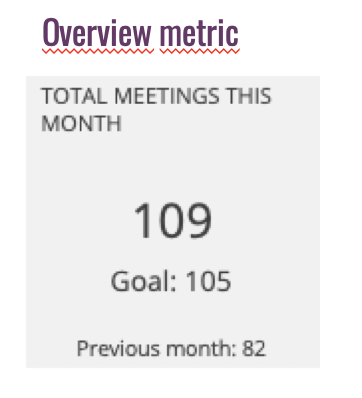
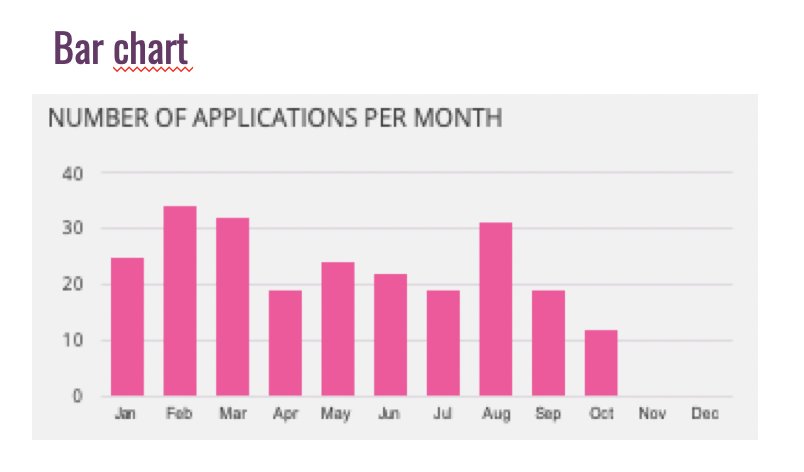
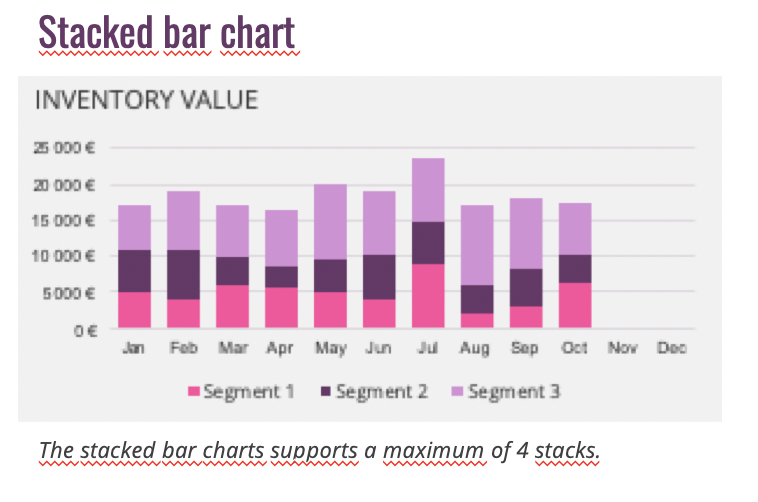
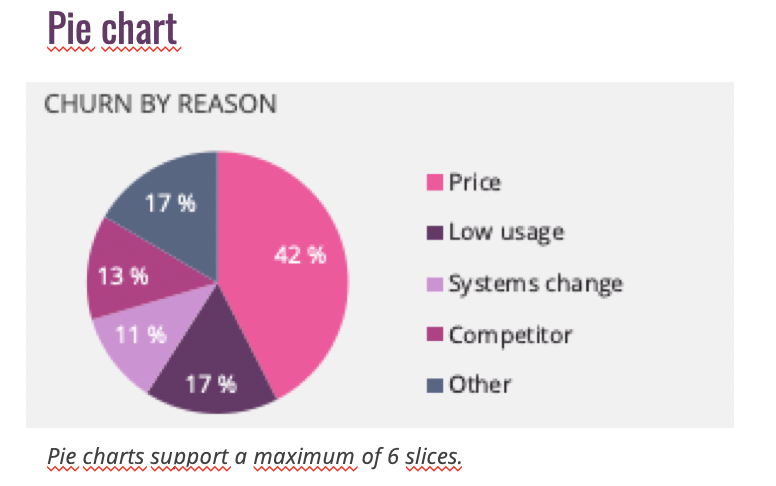
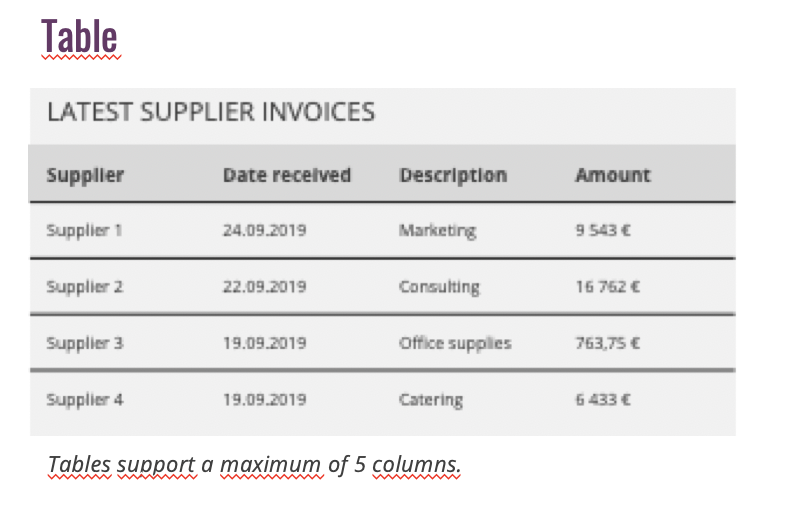
Charts and overviews have an underlying table in the drill-down, showing the details of the data comprising the chart or overview. Clicking a table will open up the full table, as only the top rows are shown on the dashboard.
3. Select a Google sheets template to use for your data
Monthly data template
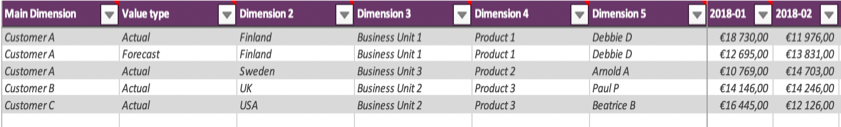
The monthly data template is suitable for data that will show monthly, or e.g. quarterly figures. Data parameters are defined in the different rows and each new month is filled in in a new column. In its simplest form, the spreadsheet contains only one Dimension / Metric column, and then a value for each new month.
Event-based data template
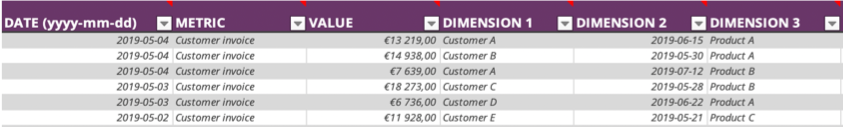
The event-based data template is suitable for data that will include many data inputs every day. For example time reports, transactions or sales activities. Data parameters are defined in different columns and each new event is filled in in a new row. In its simplest form, the table contains one date column, one metrics column and one value column.
Please see attachments to this article to download the templates.
4. Share the file with Dear Lucy
Once you have populated your data into the template, you'll need to integrate it to your dashboards to see your data. The process requires input from Dear Lucy. Please follow the steps below and see the next article in this section to complete the integration:
- Create a new folder in your Google Drive called e.g. Dear Lucy integration
- Upload the template with your data, save it as a Google Sheets document
- Log in to your dashboard environment and navigate to the following page: https://admin.dearlucy.co/yourcompany/connectors. "yourcompany" in the url represents your website url address for your dashboards.
-
Press ”Add Authentication” in the top right corner and select ”Google Sheets” from the drop-down menu. Follow the steps in the system to authenticate Google Sheets. Once the steps are completed, Dear Lucy will need to run the connector in order to complete the integration.
- Notify support@dearlucy.co file ID of the document. This is the last part of the url (web address) in your browser. It is also ok to copy the full url from your browser and Dear Lucy will be able to locate the file.
Comments
0 comments
Article is closed for comments.