Dear Lucy Projects dashboards connect to your existing Professional Services system and provide you with the 20+ most popular metrics our customers typically keep track of.
Once you create an account with Dear Lucy and integrate your system, you will instantly have three project dashboards up and running. No need to build dashboards from scratch and no coding skills required.
To make things as easy as possible to set-up, we have grouped the project metrics into three dashboards, each designed for different audience and purpose.
Once you have the dashboards up and running, feel free modify the dashboards to suit your needs. You can, e.g. resize the metrics, delete unnecessary metrics or create new dashboards mixing data from different systems and dashboards.
The pre-built dashboards are:
1) Project data for top management
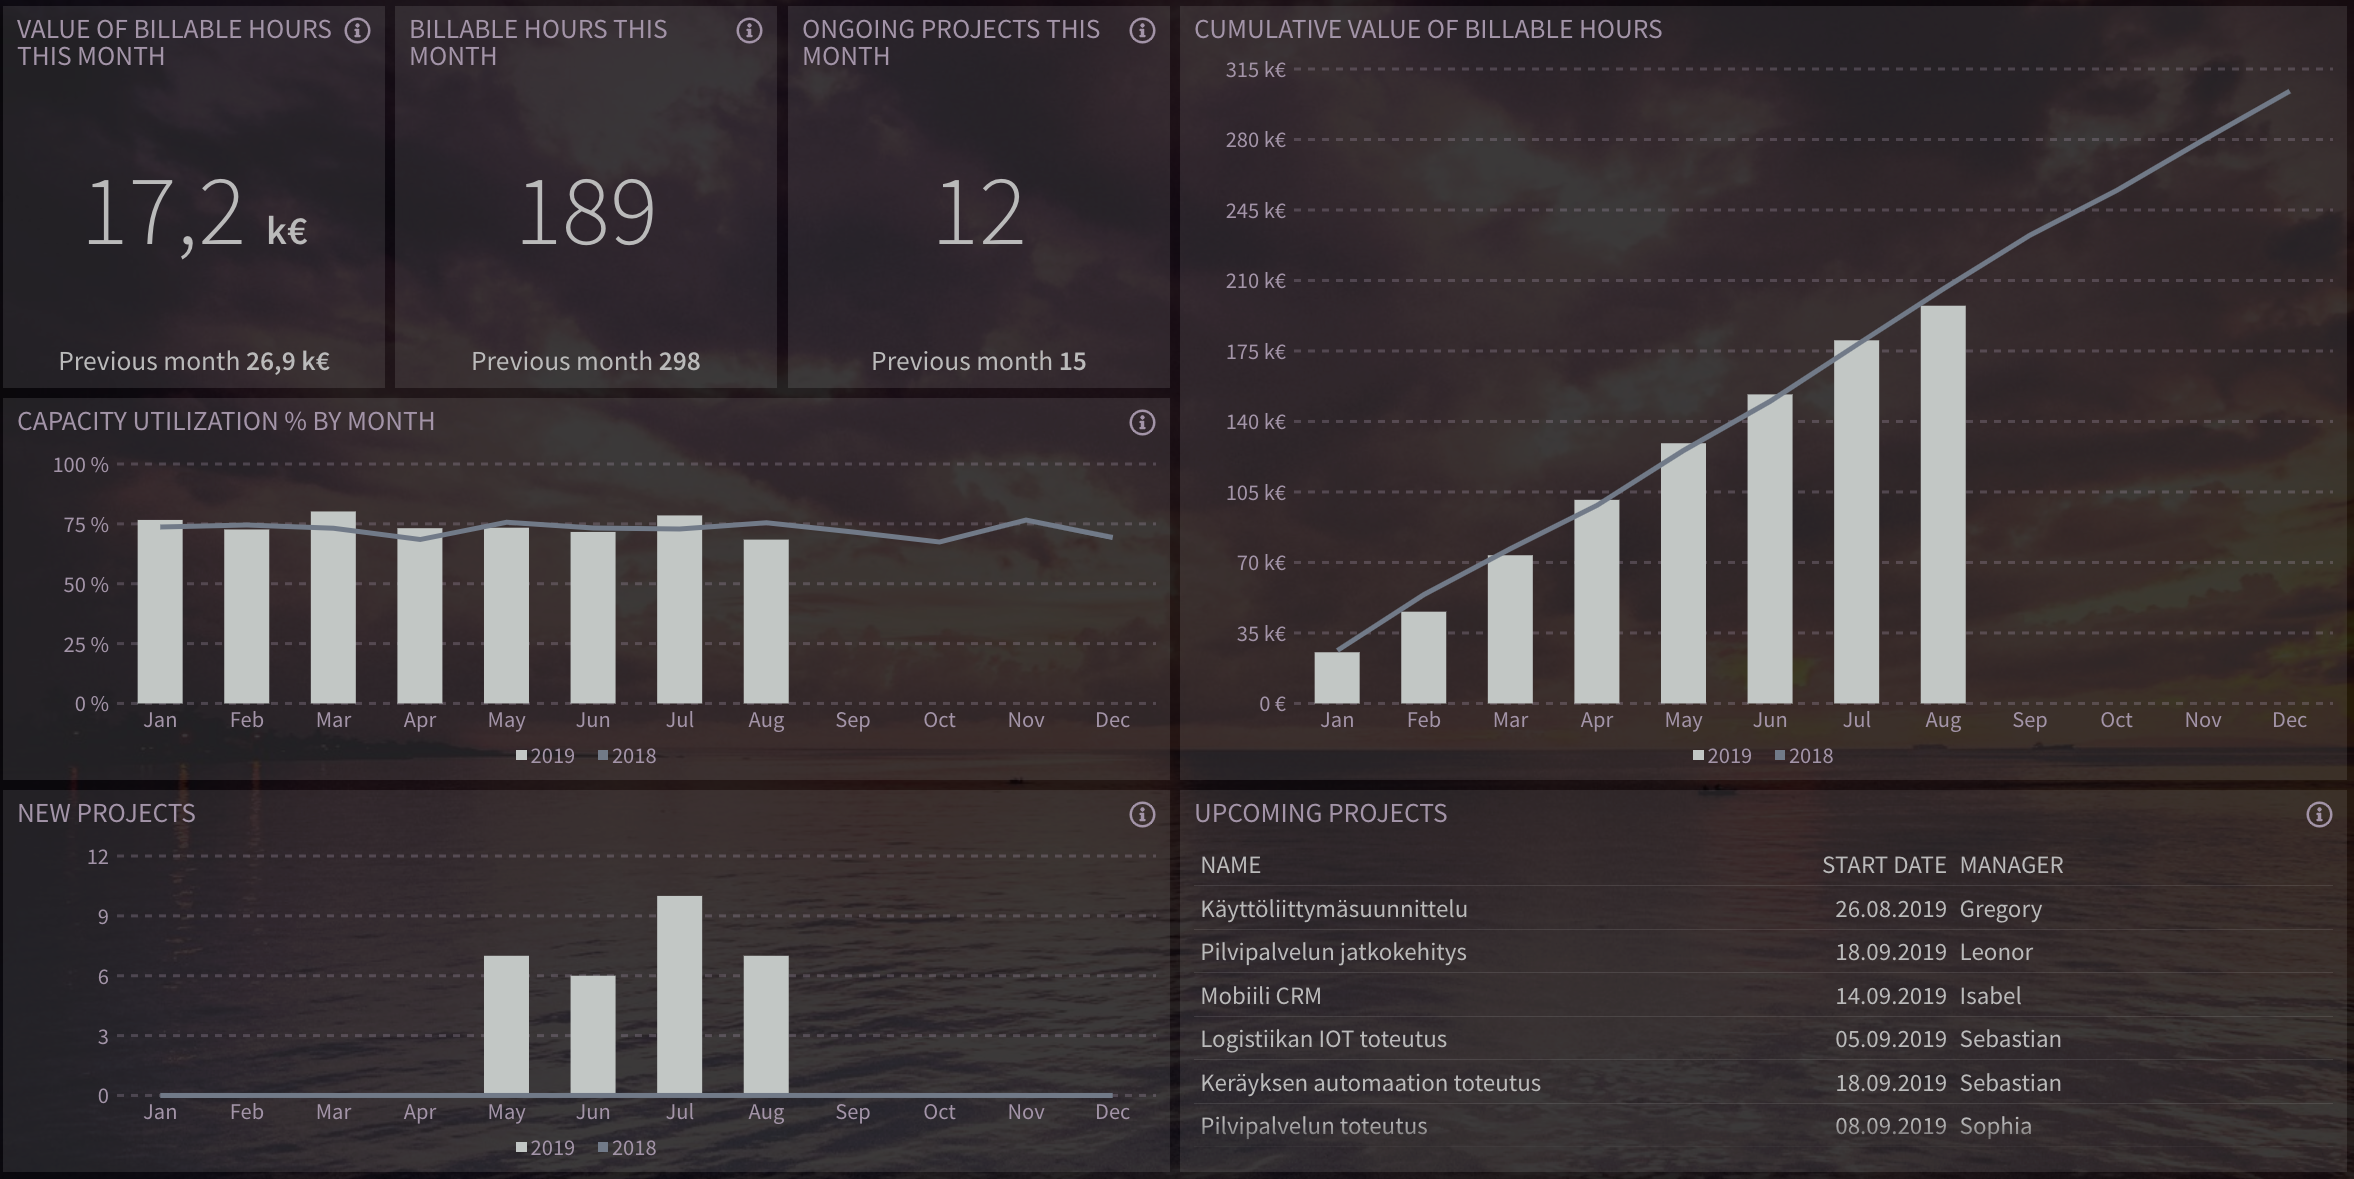
This dashboard contains top-level trend data, suitable for users who don't want or need to dig into the details too much.
2) Project data for the team members
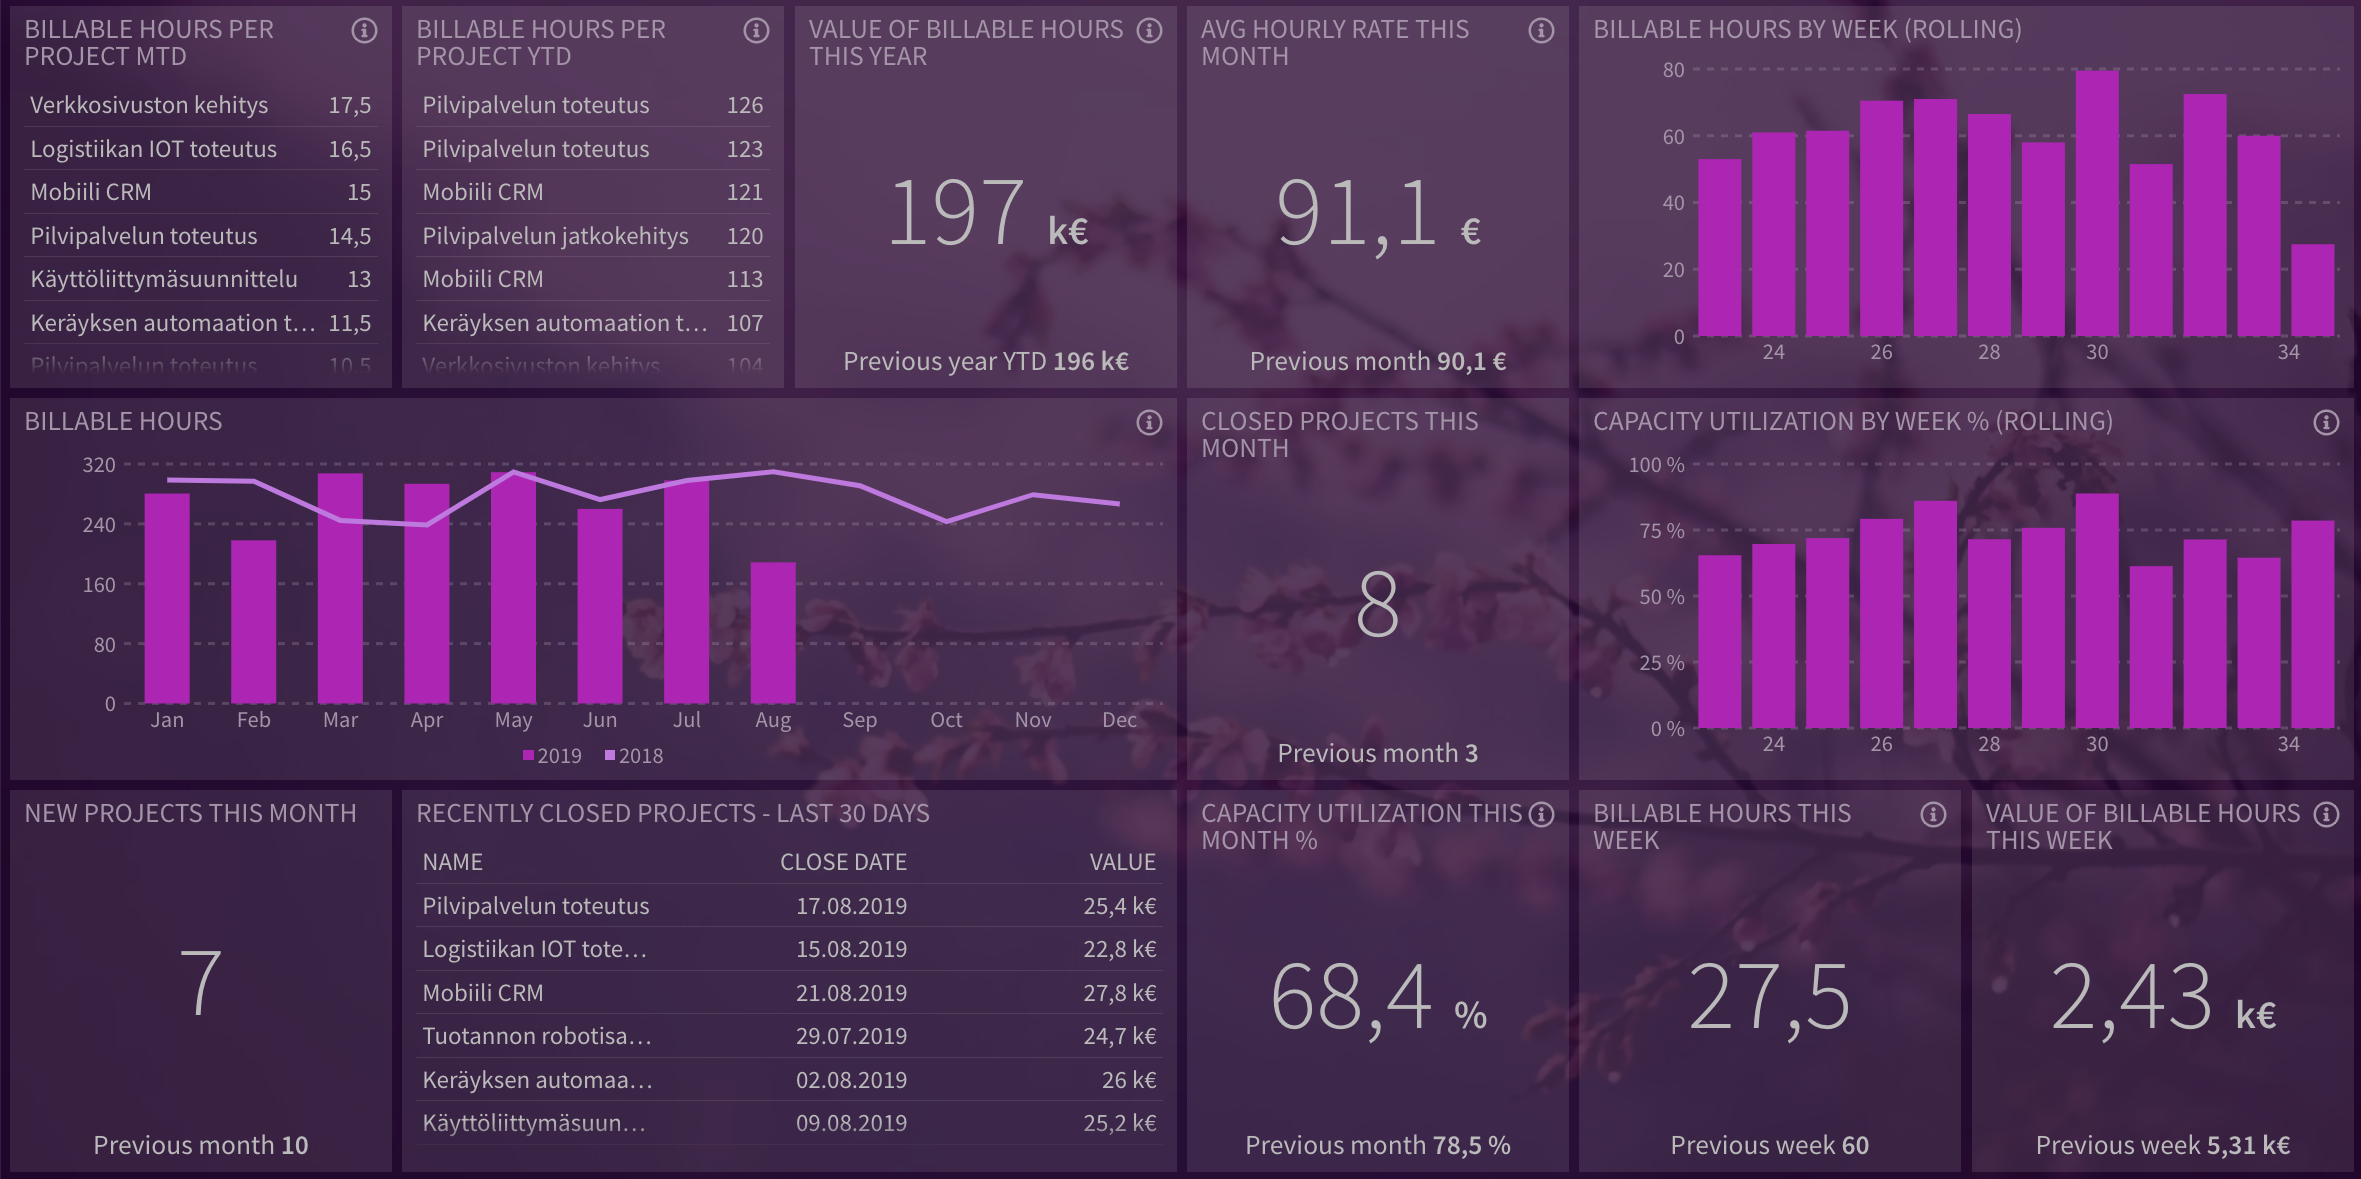
The second dashboard contains more detailed data and more granular timelines. Many of the metrics on this dashboard have weekly and rolling dates.
3) Example of a dashboard for TV screens, info-screens or intranet

The third dashboard shows metrics that are potentially less sensitive and that could be of interest to everyone in your organization, as an example of a good dashboard for an infoscreen in your office.
Please click the links below for further information about what metrics are included in the dashboards and how to integrate your professional services system. The dashboards are currently available for the following systems:
Visma Severa Projects metrics in Dear Lucy dashboards
Please note that at the moment, we do not support invoicing or financial data from Visma Severa
| Metric title | Widget type | Type of data | Time period | Description | |
| 1 | Value of billable hours this month | Overview | Currency value | This month | Unit price (or cost) x number of billable hours |
| 2 | Billable hours this month | Overview | Number | This month | Sums up the hours marked as billable in the source system |
| 3 | Ongoing projects this month | Overview | Number | This month | Projects listed as open and/or projects with a start date but no end date |
| 4 | Capacity utilization % by month | Bar chart | Percentage (%) | Monthly over the current year | Set formula: Billable hours / total hours x 100 |
| 5 | New projects | Bar chart | Number | Monthly over the current year | Number of projects with start dates corresponding to the calendar months in the chart. |
| 6 | Cumulative value of billable hours | Bar chart | Currency value | Monthly over the current year | Sums up the total monthly values of billable hours over the course of the year, cumulatively. |
| 7 | Upcoming projects | Table | Project names | Future | Lists the project name, project manager and the start dates, of all projects that have a start date in the future. |
| 8 | Billable hour per project MTD | Overview, top list | Number | Month to date | List the number of billable hours marked for different projects this month to date, in descending order |
| 9 | Billable hours per project YTD | Overview, top list | Number | Year to date | List the number of billable hours marked for different projects this year to date, in descending order |
| 10 | Value of billable hours this year | Overview | Currency value | By month this year | Unit price (or cost) x number of billable hours this year |
| 11 | Billable hours | Bar chart | Number | By month this year | Total number of billable hours by month |
| 12 | New projects this month | Overview | Number | This month | Number of projects with a start date corresponding to the current calendar month |
| 13 | Recently closed projects – last 30 days | Table | Project names | Last 30 days | Lists the name, value and close date of all projects that have been set a close date within the last 30 days. |
| 14 | Average hourly rate this month | Overview | Currency value | This month | Sum of all billable hours this month multiplied by their respective unit prices, divided by total number of billable hours |
| 15 | Closed projects this month | Overview | Number | This month | Shows the number of projects that have been set a close date within the current calendar month. |
| 16 | Capacity utilization % this month | Overview | Percentage (%) | This month | Set formula: Billable hours / total hours x 100 |
| 17 | Billable hours by week (rolling) | Bar chart | Number | Rolling 12 weeks | Number of billable hours per week, rolling 12 weeks |
| 18 | Capacity utilization % by week (rolling) | Bar chart | Percentage (%) | Rolling 12 weeks | Set formula: Billable hours / total hours x 100, per week, rolling 12 weeks |
| 19 | Billable hours this week | Overview | Number | This week | Total number of billable hours this current week |
| 20 | Value of billable hours this week | Overview | Currency value | This week | Unit price (or cost) x number of billable hours this current week |
Comments
0 comments
Article is closed for comments.